Download
1 / 6
60 likes | 63 Views
Chemical Engineering 130 u2014 Separation Processes<br>Homework #1. Solution Set.

E N D
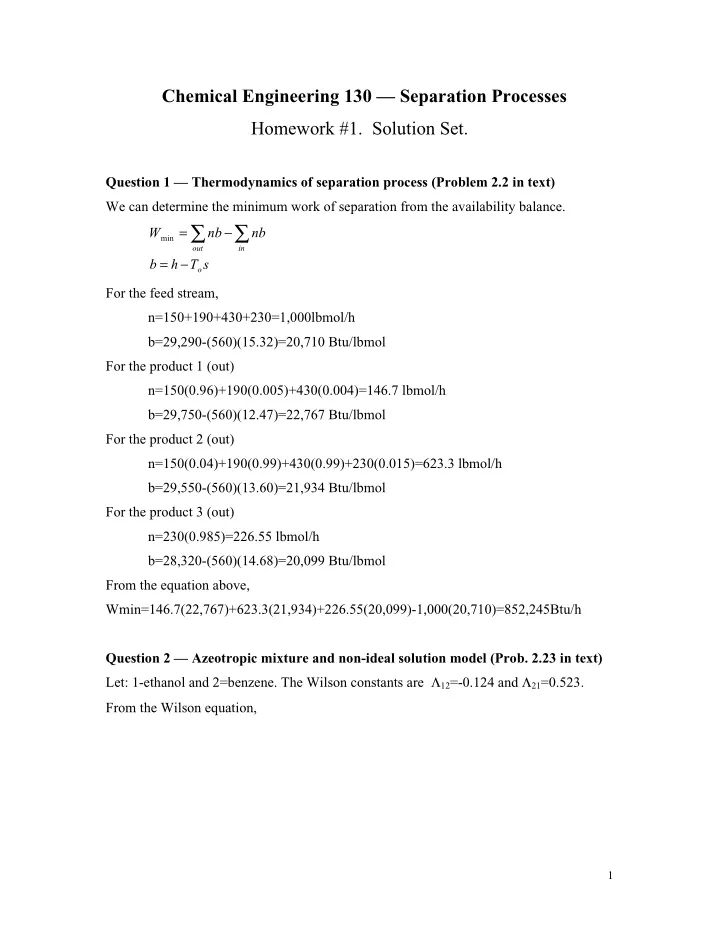
Chemical Engineering 130 — Separation Processes Homework #1. Solution Set. Question 1 — Thermodynamics of separation process (Problem 2.2 in text) We can determine the minimum work of separation from the availability balance. ∑ ∑ = − W nb nb min out in = − b h T s o For the feed stream, n=150+190+430+230=1,000lbmol/h b=29,290-(560)(15.32)=20,710 Btu/lbmol For the product 1 (out) n=150(0.96)+190(0.005)+430(0.004)=146.7 lbmol/h b=29,750-(560)(12.47)=22,767 Btu/lbmol For the product 2 (out) n=150(0.04)+190(0.99)+430(0.99)+230(0.015)=623.3 lbmol/h b=29,550-(560)(13.60)=21,934 Btu/lbmol For the product 3 (out) n=230(0.985)=226.55 lbmol/h b=28,320-(560)(14.68)=20,099 Btu/lbmol From the equation above, Wmin=146.7(22,767)+623.3(21,934)+226.55(20,099)-1,000(20,710)=852,245Btu/h Question 2 — Azeotropic mixture and non-ideal solution model (Prob. 2.23 in text) Let: 1-ethanol and 2=benzene. The Wilson constants are Λ12=-0.124 and Λ21=0.523. From the Wilson equation, 1
Using a spreadsheet, we can compare the experimental values and the data from Wilson Equations and from the results, Wilson equation fits the data well Question 3 — Vapor liquid equilibrium of binary mixtures(Problem 4.8 in text) For a constant relative volatility, we can use the definition of relative volatility and the fact that summation of mole fraction at each phase is always 1. αA,B=KA/KB=(yA/xA)/(yB/xB) (1) 2
xA+xB=1, yA+yB=1 (2) , (3) we can substitute yB and xB in the equation (1) with 1-yA & 1-xB respectively by using (2) and (3) and we can get the following relation. Solving this equation for values of xA=0 to 1 gives the following To calculate y-x and T-x-y curves from the vapor pressure data, Raoult s and Dalton s laws are combined as such and by using the fact the summation of mole fraction in the phases in equilibrium is always 1, we can eliminate two variables, xB & yB from the equations above. Finally we can get the following relations. Here we can get the K value from the vapor pressure data as well as Antonie’s equation also. From the data set, we will see that mixture of benzene and toluene has two phases 3
between 80.1C and 110.5C. Even though we don t have enough data sets in this range, we can construct data set by using Antonie’s equations that are given as a hint. Therefore by the following procedure, you can get the y-x and T-x-y graph. 1.Pick a temperature between 80.1C~110.5C 2.Calculate saturation pressure by using Antonie s equation 3.From the saturation pressure at that temperature, calculate K values 4.From the K values, get the mole fraction. Plots of y-x and T-x-y based on the above table are shown below. When the y-x plot is composed to the previous y-x plot based on a constant relative volatility, It is seen that, for a given values of x for benzene, the values of y for benzene are in fairly close agreement. From the above table, the α ranges from 2.62 at 80.1C to 2.32 at 110.5C 4
(a)To find the temperature at 25 mol% vaporization, starting with a liquid mixture of 70 mol% benzene and 30 mol% toluene, extend a dashed, vertical line upward from point M on the T-y-x diagram until point B is reached. At this point, using 5
the inverse lever-arm rule, the ratio of the AB line length to the BC line length is 25/75. The temperature is 88C. the benzene mole fraction of the equilibrium vapor when condensed is the same as the equilibrium vapor at point C or 0.88. the benzene mole fraction in the residues liquid is the same as the equilibrium liquid at point A or 0.65 (b)The K values are included in the above table, and are plotted below 6

![‘ {]](https://cdn1.slideserve.com/1577347/slide1-dt.jpg)