Download
1 / 15
150 likes | 155 Views
This map exercise uses seismic data from a 3D fault model to recommend the best dam site based on geological reasons. Find out which site should be chosen for building the new reservoir.

E N D
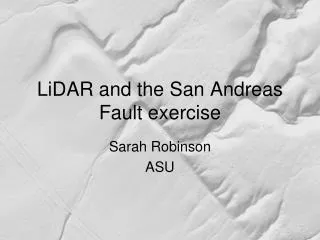
Map exercise using the 3D fault model Using seismic data to position a dam
A map exercise using the 3D fault model A water company has decided to build a new reservoir to help counter water shortages experienced in the summer for several years. Three possible locations for the dam have been identified in the river valley and are marked on the map below as sites A, B and C. Use the seismic data from the 3D model to recommend geological reasons for which site should be chosen. A geologist or structural engineer will often undertake this sort of task. Hint: Mark on the map the CMP position of the fault plane at 0msec.
Position of fault plane at 0 msec CMP N CMP C B A 260 220 220 240 240 Line S2-11 20 20 40 40 80 80 140 140 120 120 160 160 180 180 200 200 100 100 Map showing position of seismic lines and proposed location of the three dam sites Key Proposed site of dam Line S1-11 1 km Hint: Mark on the map the CMP position of the fault plane at 0msec
Extension Taking a closer look at the fault plane and its movement
1. To investigate the movement along the fault plane plot on the map the position of the fault plane at 600msec.
Position of fault plane at 0 msec CMP N Position of fault plane at 600 msec CMP C B A 260 220 220 240 240 Line S2-11 20 20 40 40 80 80 140 140 120 120 160 160 180 180 200 200 100 100 Map showing position of seismic lines and proposed location of the three dam sites Key Proposed site of dam Line S1-11 1 km
If the fault had moved straight down in the dip-slip direction, then we would expect the plot of the fault plane lines to be parallel. But the two fault plane lines are not parallel, what other sort of movement must have occurred? A rotation.
2. Can we find any other evidence to support the idea that a rotation has occurred? We could try measuring the throw.
Line S1-11 Line S2-11 ⇂ ⇃ ↿ ↾ 52msec @ 2400m/s = 125m Throw at yellow horizon 52msec Throw at yellow horizon 45msec 45msec @ 2400m/s = 108m The throw can be measured at the interpreted horizon (yellow dashed line). The seismic velocity is 2400m/s, calculate the throw in metres. Why is the throw not the same amount on each line? Seismic data only shows a side-on 2D image of the subsurface along a line. This means it is not possible to actually see any strike-slip displacement. We have to use other evidence to deduce what has happened. It is very common to find rotated blocks. Which way has this block rotated?
Position of fault plane at 0 msec CMP N Position of fault plane at 600 msec CMP C B A 260 ● 220 220 240 240 Line S2-11 On line S2-11 throw at yellow horizon 108m 20 20 40 40 80 80 140 140 120 120 160 160 180 180 200 200 100 100 Map showing position of seismic lines and proposed location of the three dam sites On line S1-11 throw at yellow horizon 125m ● Displacement greater at south side of fault ⤷ Key Proposed site of dam Line S1-11 1 km
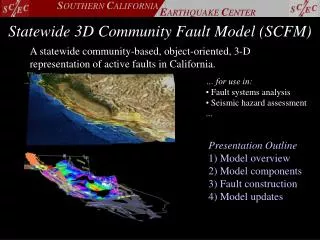
Regional view Fault plane derived from other seismic lines (not plotted on map) The fault plane extends for several km to the north and south. The throw gets less and less until the fault dies out. Notice the shape of the fault plane.
Conclusion By examining the seismic data more closely it can be seen that: The fault moved down in a dip-slip direction towards the east. The southern end of the fault has a greater downthrow than the north indicating a rotation has occurred. Faults are not uniform, the throw is variable and they are often curved. Faults eventually die out.