Download
1 / 60
600 likes | 715 Views
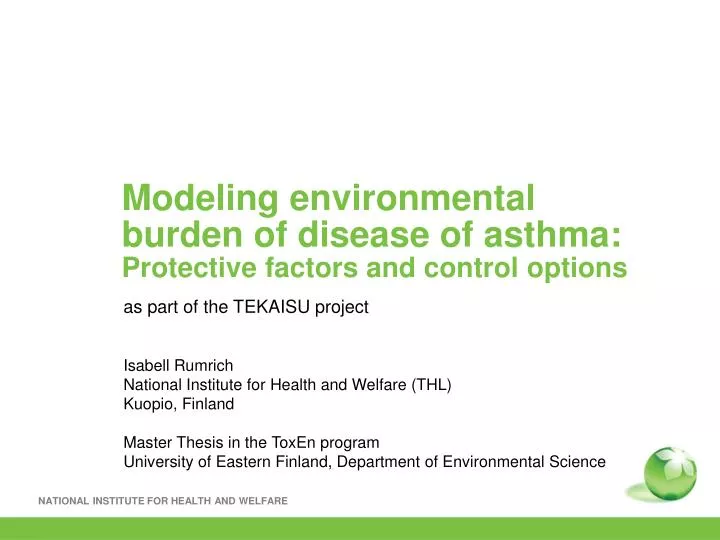
Modeling environmental burden of disease of asthma: P rotective factors and control options. as part of the TEKAISU project Isabell Rumrich National Institute for Health and Welfare (THL) Kuopio, Finland Master Thesis in the ToxEn program

E N D
Modeling environmental burden of disease of asthma:Protective factors and control options as part of the TEKAISU project Isabell Rumrich National Institute for Health and Welfare (THL) Kuopio, Finland Master Thesis in the ToxEn program University of Eastern Finland, Department of Environmental Science
Outline • Introduction • Background data • Associated Factors • Control Policies • Discussion 2
Asthma • Chronic inflammatory disease • Prevalence as high as 9.4 % (2007) • Currently only symptomatic treatment • Pathology is characterized by miss-regulation of immune responses • Various factors have been proposed to be associated with onset or symptoms: anthropogenic and natural environmental factors, lifestyle related stressors, pharmaceutical stressors, internal factors, genetic susceptibility and co-morbidities 3
IHME estimates of BoD (YLDs) in 2010 Asthma: • 2% of total YLDs in 1990 and 2010 • Maximum for 5-9y old (2010) 13% of total YLDs biggest contribution to total YLD http://viz.healthmetricsandevaluation.org/gbd-compare/ 4
From the Model to Control Policies Asthma BoD Risk Ratio Attributable Can not be changed Attributable Exposure Can be changed Reducible Fraction Genes Lifestyle • Exposure can be changed by relatively easy measures • Already existing policies • Development of hypothetical policies • Modelling of effect of exposure change Other factors Environmental Factors Co-morbidities
Selection of exposure factors Literature Search Review Table Model Lack of evidence; Duplication of factors Policies Lack of data; Lack of significance Impact on asthma burden 15 factors 235 articles 35 factors 6 factors Databases: PubMed, Scopus, Web of Science – WoS (ISI), SpringerLink and Science Direct (Elsevier). Search queries: asthma; asthma AND environment*; asthma AND risk; asthma AND environment* NOT atopy; asthma AND risk NOT atopy; asthma AND mechanism; asthma AND risk NOT occupation*; asthma AND environment* NOT occupation* 6
Outline • Introduction • Background data • Associated Factors • Control Policies • Discussion Attributable Reducible Fraction Attributable Asthma BoD 7
Incidence & Prevalence • Incidence: number of new cases in a specific period of time number of new individuals entitled to reimburse expenses for asthma medication during one year • Prevalence: number of all cases at a specific time point total number of individuals entitled to reimburse expenses for asthma medication at the end of a year • Data provided by KELA statistics
Burden of Disease - YLD Years Lived with Disability (YLD) a) Incidence based: b) Prevalence based: YLDI = YLDP P x DW = I x D x DW D = I = Incidence; DW = Disability Weight; D = Duration; P = Prevalence
Outline • Introduction • Background data • Associated Factors • Risk Factors • Protective Factors • Control Policies • Discussion Attributable Reducible Fraction Attributable Asthma BoD 15
Attributable incident cases and residual at baseline (2011) Smoking; 0%
Outline • Introduction • Background data • Associated Factors • Control Policies • Tobacco Smoke • PM2.5 • Dampness and Mould • Pets • Discussion Attributable Reducible Fraction Attributable Asthma BoD 20
Summary Risk & Protective Factors Residual; 7922 8 000 Protective Factors
Impact of Tobacco Control Policy Smoking Smoking
Impact of PM2.5 Control Policy Small Scale Wood Combustion
ReductionPotential of Control Policies Tobacco Wood Combustion Dampness
Reducible Fraction of the total 25y cumulative Incidence More realistic Most efficient
Efficiency Control Scenarios – combined Incidence & Prevalence
Outline • Introduction • Background data • Associated Factors • Control Policies • Discussion 38
Limitations • Population Life Table • Neglecting of (Im-)migration • Use of YLD instead of DALY • Each year a very low number of death due to asthma neglected • Discounting • Discounting decreases estimates for future years compared to non-discounted estimates
Uncertainties • Trend estimations • Uncertainty about the future trends in asthma and exposures • Evidence • Overall very weak (association with atopy) • PM source has impact on toxicological profile • Duration • Duration has impact on incidence based YLD estimate longer duration increases YLD estimate
Conclusion • Accumulation of prevalent cases in older age groups • Asthma duration is increasing and age dependent • About half of the total BoD can be theoretically explained • BoDcan be reduced (up to 20%) by reducing exposure to risk factors
DisabilityWeights Leukemia Liver neoplasm Meningitis Cretinism Asthma 0 1 Perfect Health 0,1 0,2 0,3 0,4 0,5 0,6 0,7 Death 0,8 0,9 Dentalcaries 1st strokeever Severe Depressive Episode Acutemycardial infarction
Comparison YLD_I and YLD_P 1986 2011
2015 2040
Attributable YLD_I & attributable YLD_P – Comparison I Baseline (2011) 49
Attributable YLD_I & attributable YLD_P – Comparison 1986 2006