Download
1 / 26
270 likes | 436 Views
Data Smoothing and Noise Removal. D. Gordon E. Robertson, PhD, FCSB School of Human Kinetics, Faculty of Health Sciences. Issues. All data collected from human subjects has some imbedded error (noise). A signal is the desired information in a waveform. Noise is the unwanted part.

E N D
DataSmoothing and Noise Removal D. Gordon E. Robertson, PhD, FCSB School of Human Kinetics, Faculty of Health Sciences
Issues • All data collected from human subjects has some imbedded error (noise). • A signal is the desired information in a waveform. • Noise is the unwanted part. • What are the characteristics of your signal? • What is the noise in your data? • What factors need to be considered to faithfully record your signal? • What is the best technique for reducing the influence of the noise?
Characteristics of a Signal Waveform • What is the signal’s amplitude, measured by “dynamic range”? • dynamic range = maximum – minimum • obtained from theory, literature, or a pilot study • Is signal AC or DC? • average value of an AC signal is zero, e.g., ECG, EMG • some transducers are AC-coupled and therefore cannot record DC signals such as force, displacement, temperature, e.g., piezoelectric transducers • What is the frequency spectrum (range of frequencies)? • muscle force is DC to 10 HZ, EMG is 20 to 500 Hz • do all systems record across this range • is sampling rate of collection system high enough (>2x) ?
Characteristics of a Measurement System • AC or DC coupled? Electronics can compensate, i.e., permit DC signal with AC transducer or remove DC offsets from AC signals • Is system capable of amplifying signal without causing saturation. How do you test if it has correct amplification? Must never saturate any instrument in the measurement chain. This cannot be corrected post facto. • Do all transducers in the measurement chain have correct frequency spectrum to match signal’s spectrum? If violated cannot be corrected. • Where can interference or random noise be introduced and how can they be reduced or eliminated. I.e., proper grounding and shielding. Noise may be possible to attenuate. • Does the system introduce a known or unknown delay?
Measurement System • Each measurement system is a series of instruments in the measurement chain. • E.g., transducer, pre-amplifier, signal conditioner, output amplifier, A/D converter, input amplifier, storage medium
Measurement System • Example, electromyography (EMG) transducer (electrodes) signal conditioner input amp, A/D and pre-amp (receiver), output amp converter, storage
Measurement System • Example, force transducer transducer (strain signal conditioner input amp, A/D gauge) (bridge amp) converter, storage
What is a Waveform? • A waveform is any time-varying or spatial-varying series of related data. Usually collected by A/D converters of computer. • W(t) • It can be a known mathematical function (e.g., sine wave) • W(t) = a sin (2pf t + q) generalized sine wave with frequency f (cycles per second), amplitude a (arbitrary units) and phase lag q (radians). or a series of data sampled at regular or irregular known intervals. • W(t) = a(t) • Can contain both signal (information) and/or noise
What is a Signal? • A signal is the information carried in a waveform or a physical quantity that can carry information. • It is the portion of the waveform that carries the desired information of the researcher. • In mathematical waveforms there is typically only signal in the waveform. • In data sampled from electronic or other devices there is always some part of a waveform that is not signal, called noise.
What is Noise? • Noise is the part of a waveform that is not signal! • The unwanted errors in a waveform • Noise can be random (white) or have a statistical distribution • Noise can be due to interference from another signal (called cross-talk) or induced by physical devices near the medium carrying the waveform (e.g., electric motors, radiation, power cords, radio waves). • Noise can occur at random intervals (e.g., bumping of electrodes, power surges, floor impacts nearby) or regular (50/60 Hz line interference) or irregular intervals (e.g., ECG or EEG interference of EMGs). • Noise may have frequencies inside or outside the frequency range of the signal (if outside, filtering can effectively reduce the noise).
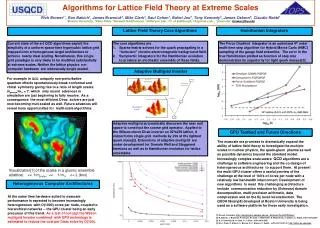
60 Hz noise an impact spike heart rate detected Examples of Noise in an EMG signal
What Techniques are Available? • Moving averages (e.g., Chapman) • Curve (spline) fitting and interpolation (e.g., Wood & Jennings 1979, Felkel 1951, Woltring 1986) • Digital filtering (e.g., Winter et al. 1974) • Fourier reconstruction (e.g., Hatze 1981)
Moving Averages • Very simple and easy to implement • Usually have time lags • Unweighted and weighted averaging are possible • Will always attenuate peaks and valleys even if they are valid • Need to select a window width (n), usually an odd number • MAV(ti) =
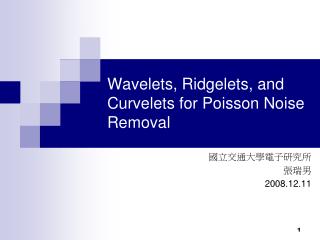
Moving Averages • rectified EMG (1010 Hz sampling rate) • averaged EMG (moving average, 51 points)
Curve Fitting and Splines • If signal has a known mathematical function (e.g., line, parabola, exponential function) then a “best fit” criterion may be used to extract the true signal from the waveform • Piecewise polynomials (splines) may be used to fit curves of long duration that cannot be fitted by a single function, such as a polynomial. • Spline functions do not require equally time intervals in the waveform and therefore may be used to fit gaps in data files. • The “Woltring” filter, aka generalized cross-validatory (GCV) spline filter uses b-splines to filter noise. It behaves similar to a bidirectional, zero-lag, Butterworth filter.
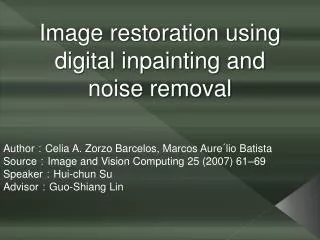
Curve Fitting and Splines Vaughan’s (1982) golf ball data with and without noise (±0.1) and fitted polynomial of order 2.
Digital Filtering • Used on data that have been sampled with fixed time intervals. • Types: • low-pass, high-pass, band-pass, band stop and notch (single or small band-stop filter, useful for AC interference) • Designs: • Butterworth (optimally flat in bandpass), critically-damped, Chebyshev etc. (sharper cutoffs), Generalized Cross-validatory (GCV also called Woltring filter, 1986) • Problems: • Noise spikes alter a localized period in the signal • Phase distortion (usually phase-lags occur) • Does not reduce size of data file
Fourier Reconstruction • Once a Fourier series has been extracted from a waveform many cycles may be created • Requires signal to be cyclic or made cyclic with “windowing” functions (Hamming, Blackman, Cosine bell, etc.) • Can reduce a complex signal to a very few number of coefficients • Problems: • Noise spikes can significantly alter overall cyclic pattern • Can distort signal in unpredictable ways
How to Decide on the Best Technique? • Visually compare original noisy signal with smoothed signal (Pezzack et al. 1977). Smooth signal should pass through middle of the noisy waveform without distorting peaks and valleys. • Evaluate smoothing technique against known mathematical functions (e.g., Robertson & Dowling 2003) • Evaluate smoothing technique against published data (e.g., Wood & Jennings 1979; Hatze 1981; Lanshammar 1982; vs. Pezzack et al. 1977) • Evaluate residuals mathematically (e.g., Jackson 1979; Winter et al. 1984). • Simulation (Walker 1998, Nagano et al. 2003)
Removing High Frequency Noise • Essential for data that are to be doubly-differentiated (e.g., computing acceleration from displacement data) • Low-pass filtering is the most common (Winter 1974, Pezzack et al. 1978) • Need to select an appropriate cutoff frequency and roll-off (filter order) • Critically-damped filters may be better for rapid transients (Robertson & Dowling 2003) • Butterworth filters have better roll-offs, i.e., better attenuation in the “reject band” • Zero-lag filters can be achieved by filtering forwards and backwards digitally
Removing Low Frequency Noise • Essential for doubly-integrating data (e.g., integrating force to obtain displacement) • Bias removal is critical • High-pass filters (Murphy & Robertson 1992) • End-point problems need to be considered (pad with means, zeros, reflexively, e.g., Smith 1989, Walker 1998) With bias Subtract mean High-pass filter (10 Hz)
Removing Noise Spikes • Low-pass filtering may not be effective, perhaps use higher order, Butterworth filter, or critically-damped filters • Interpolate across spike or artifact • Moving median (use smallest window possible) • Sine wave with spikes (all single samples except one) • All but one removed (it had double the width)
How to Prevent Phase Distortion • Centrally weighted moving averages • Filter in both directions (Winter et al.1974) • Zero-lag filters (b-splines, Woltring 1986) Green is original Cyan is zero-lag Red has lag
How to Prevent End-point Transients • Collect extra data before and after critical period • Padding points • zeros • means • reflexive (Smith 1989) • linear extrapolation (Vint & Hinrichs 1996) • Windowing functions are useful for Fourier analysis • Cosine bell, Blackman, Hamming, Hanning, triangular etc. Triangle No padding Pad with means Pad reflexively
References • Felkel, E. 0. (1951) Determination of acceleration from displacement-time data. Prosthetic Devices Research Project, Institute of Engineering Research, University of California, Berkeley, Series 11, 16. • Hatze, H. (1981) The use of optimally regularised Fourier series for estimating higher-order derivatives of noisy biomechanical data. Journal of Biomechanics, 14:13-18. • Jackson, K.M. (1979) Fitting of mathematical functions to biomechanical data. IEEE Transactions on Biomedical Engineering, BME-26(2):122-124. • Lanshammar, H. (1982) On practical evaluation of differentiation techniques for human gait analysis. Journal of Biomechanics, 15:99-105. • Murphy, S.D. & Robertson, D.G.E. (1992) Construction of a high-pass digital filter. Proceedings of NACOB II, Chicago, 95-96. • Pezzack, J.C.; Winter, D.A. & Norman, R.W. (1977) An assessment of derivative determining techniques used for motion analysis. Journal of Biomechanics, 10:377-382.
References cont’d • Robertson, D.G.E. & Dowling, J.J. (2003) Design and responses of Butterworth and critically damped digital filters. Journal of Electromyography and Kinesiology, 13(6):569-573. • Smith, G. (1989) Padding point extrapolation techniques for the Butterworth digital filter. Journal of Biomechanics, 22:967-971. • Vaughan, C.L. (1982) Smoothing and differentiation of displacement-time data: An application of splines and digital filtering. Int. J. Bio-Med. Comp. 13:375-396 • Vint, P.F. and Hinricks, R.N. (1996) Endpoint error in smoothing and differentiating raw kinematic data: an evaluation of four popular methods. Journal of Biomechanics, 26:1637-1642. • Winter, D.A.; Sidwall, H.G and Hobson, D.A. (1974) Measurement and reduction of noise in kinematics of locomotion. Journal of Biomechanics, 7:157-159. • Woltring, H.J. (1986) A Fortran package for generalized cross-validatory spline smoothing and differentiation. Advances in Engineering Software, 8:104-113. • Wood G.A. and Jennings, L.S. (1979) On the use of spline functions for data smoothing. Journal of Biomechanics, 12:477-479. • Wood, G. (1982) Data smoothing and differentiation procedures in biomechanics. Exercise and Sport Sciences Reviews, 10:308-362.