Download
1 / 39
400 likes | 439 Views
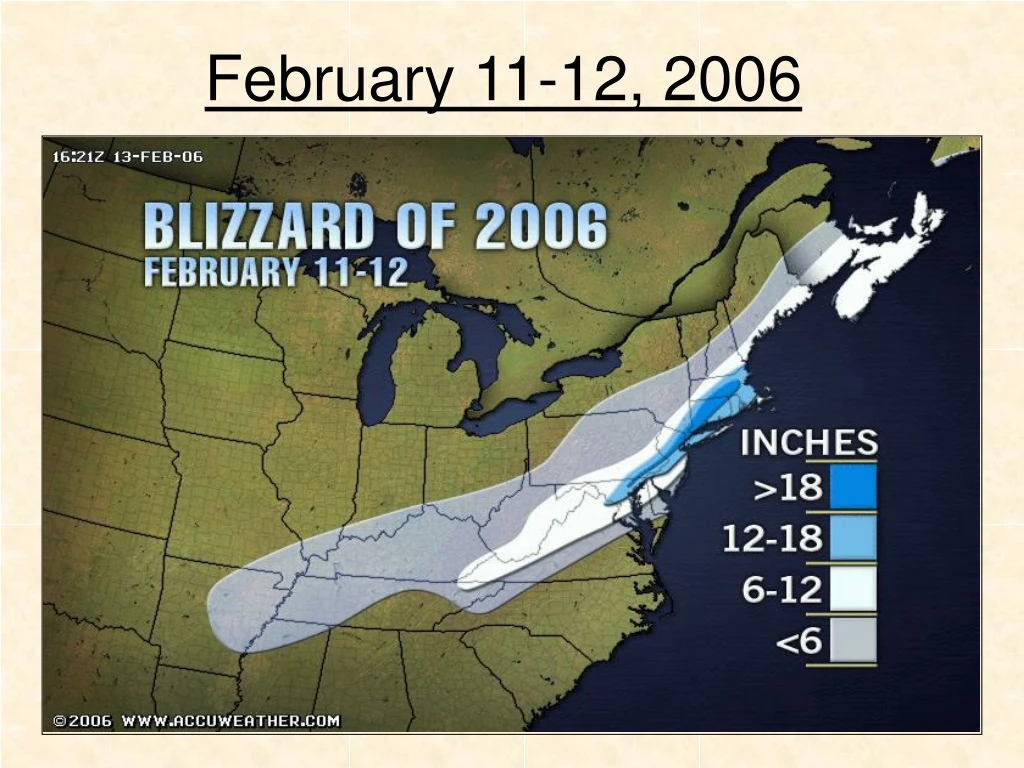
February 11-12, 2006. Heavy Snow Event Checklist for PHL. NAO index = 4 Position of high pressure = 4.5 Strength of high pressure = 4 Track of surface low = 5 Low level cold air = 4 PNA index = 5 EPO index = 5 Weak La Nina = N/A MJO phase = 5 3 parts (phases) of a snowstorm = 5.

E N D
Heavy Snow Event Checklist for PHL NAO index = 4 Position of high pressure = 4.5 Strength of high pressure = 4 Track of surface low = 5 Low level cold air = 4 PNA index = 5 EPO index = 5 Weak La Nina = N/A MJO phase = 5 3 parts (phases) of a snowstorm = 5 Character of 500 mb trough (position, strength, amplitude, jet streaks, and evolution) = 5 Character of vorticity maximum = 5 Track of 850 low = 5 Strength of 850 low = 5 Track of 700 low = 5 Strength of 700 low = 5 50-50 low = 4 Polar vortex = 5 1 = bad for HSE in PHL; 5 = good for HSE in PHL
Storm Highlights (NWS) • There have only been 8 storms in Philadelphia during the month of February tallying 12 inches or more in 125 years of record keeping! That is 1 every 15/16 years on average. • Storm lasted less than 24 hours. Most areas were reporting snow by 3pm on Saturday and snow had ended in most areas by 9 am on Sunday. • Storm had 3 phases. Phase 1 = overrunning (Sat afternoon and evening), phase 2 = storm snow (sat night into early Sun am), and phase 3 = wrap around (Sun am). Anytime we receive accumulating snow from all 3 phases, 8 inches is nearly a guarantee.
Storm Highlights (NWS) • An area of low pressure developed along the Gulf states on Friday February 10th, and began moving to the northeast toward the North Carolina coast during Saturday. The system rapidly intensified as it moved near the New Jersey coast and then toward the New England coast. Snow began Saturday afternoon and evening. The snow fell steadily, and heavily at times in many areas, overnight Saturday and into Sunday morning, until the final strong band passed through during the early to mid morning hours on Sunday. All snow had ended by Sunday afternoon/evening.
Storm Highlights (NWS) • Phase 1 of the storm had wide geographical variance due to crucial differences in surface temperatures. Areas south and east of PHL were above 32 degrees. Snow did not accumulate here until well after dark. Areas north and west of PHL were 32 degrees or less. Here, the overrunning event provided anywhere between 1 and 6 inches of snow. • During phase 3 of the event, many areas experienced very heavy snowfall rates, up to 3 to 4 inches per hour at the storm's most intense peak. As the strongest band of snow began to set up toward the end of the event, many reports of thunder snow came in, showing how dynamic and intense this system really was.
Phase 1 of Storm: Overrunning Snow Areas to the S & E of Philadelphia received lower snow accumulations than expected, against what some computer models were indicating, due to prevailing winds off the 40 degree +ocean during most of the storm Temperatures (5pm on Saturday) were crucial during this phase. Some areas were receiving sticking snow at 3pm; other areas did not receive sticking snow until after 9pm. 32°
Gulf Stream/Atlantic OceanStorm Intensity and Lower Snow Accumulations S & E of Philadelphia Usually the warmer ocean (cooler land or air over land) finds a way to change snow to rain with any big storm moving up the coast, but the cold air in place ahead of the storm and the perfect storm track combined for a worst-case scenario (Glenn “Hurricane” Schwartz). That’s 70 degree + water off the coast of NC in February!
Storm Highlights • NESIS category 3 storm. Considered a “Major” snowstorm. Blizzard like conditions experienced by some areas within the states of Pennsylvania, New York, New Jersey, and Connecticut. Record breaking snowfall totals in New York City and parts of Connecticut. New York City (Central Park Zoo) broke their all time snowfall record for one storm recording 26.9 inches. • Three key factors in the variance of total snow accumulation across the area were: temperatures during phase 1 of the storm, snow ratios during the storm (higher ratios N and W of PHL), and the exact locations of where the heavy snow bands set up and then propagated.
NESIS Comparison The “Blizzard of 1996” ( a NESIS category 5 storm) for comparison purposes against the February 2006 storm (a NESIS category 3 storm)
High Pressure Strength and Position (1pm on Saturday) • High pressure anchored north of PA/NY border and west of Maine coastline. The high stayed in good position throughout the storm and stayed above 1022 hPa.
Storm Track (3pm Sat, 11pm Sat, 5am Sun) Wonderful track for heavy snow in Philadelphia. 1. Inside Cape Hatteras, NC. 2. Just off of Delmarva Peninsula but NOT over it. 3. Avoid Cape Cod, MA insuring a NE or ENE track.
850 mb Low (1 am on Sunday) • Closed, intensifying, and south of Philadelphia, but not too far south. Over Delmarva moving easterly is perfect for PHL region. Phase 2 of the storm.
NAO Index • NAO was weak negative prior to the storm, but trending sharply positive (this is called “relaxing”). • This NAO trend of negative to neutral of positive is often key in the development and propagation of East coast snowstorms.
PNA Index • PNA was strong positive during the storm. • A strong positive PNA promotes ridging over the West coast and a trough over the East Coast. With this setup a shortwave (low) is better apt to develop into a storm and then ride up the Eastern seaboard. Time of storm
PNA Index • Note the strong ridge over the West coast. The short wave that came underneath the ridge through southern California is undergoing partial phasing with the polar jet stream…and viola...we have a storm in the Tennessee Valley/Delta region heading ENE. Red arrow = direction of shortwave energy Orange arrow = polar jet stream, phasing with shortwave Blue arrow = ridge over West coast
EPO Index • When the EPO is dominated by a negative phase (as with the NAO), more ridging develops along the West Coast as higher pressure extends from the Gulf of Alaska south along the West Coast of Canada (opposite of the positive phase). This, in turn, encourages a northwesterly flow from Canada into the middle and eastern sections of the US and thus, the delivery of polar or arctic air.
MJO Phase Although much is uncertain, phases 7 and 8 of the MJO appear to be the most favorable for large scale East coast snowstorms due to the above heights (high pressures) over and near Greenland which in turn impacts the negative NAO.
850 Low (7 am on Sunday) • Heaviest snow band over the I-95 corridor at this time. Rates of 2 to 4 inches per hour. Phase 3 of the storm.
Local Radar (7:30 am on Sunday) • Fantastic snow rates of 2 to 4 inches per hour. This was phase 3 of the storm providing us with wrap around snow. L
700 mb Low (Forecast Issued at 5pm on Saturday for Sunday 4 am) The RUC was saying “watch out.” This model is becoming a great short range model for East coast snowstorms (courtesy of DT).
700 Low (7 am on Sunday) 700 low in fantastic position! Phase 3 of the storm well underway.
Local Radar (7:30 am on Sunday) • Fantastic snow rates of 2 to 4 inches per hour. This was phase 3 of the storm providing us with wrap around snow.
50-50 Low (Saturday at 1pm) The 50-50 low is in place. Sneaky little thing did not look like it was going to be there prior to the storm. Open wave trough with positive tilt, heading towards closed neutral and then, closed negative.
Jet Streaks (7 pm on Saturday) “Textbook” jet streak setup as described by Kocin and Uccellini. One streak at base of trough, one streak near ridge axis. Closed 500 hPa low in Ohio. Closed low aided in the intensity of phases 2 and 3 of the storm.
500 mb (11 pm on Saturday) • Storm really started cranking at this point. Just what we needed for heavy snow.
500 hPa Closed Low (1 am on Sunday) • Closed low in Ohio. Polar vortex in North Hudson Bay. Prior to the storm the PV was located in southeastern Canada, then it split.
500 mb Absolute Vorticity (7 am on Sunday) 7am on Sunday…look at all that energy focused on one little area. (courtesy of Jeff B.)
500 hPa Vorticity Maximum (7 am on Sunday) Note the energy transfer. Vorticity maximum (violet) just SE of Philadelphia. Note the light blue shading over Harrisburg, PA and NNE—the best snows are in between the two.
US Radar (5:45 pm on Saturday) Radar looked great at this time. You could just tell something special was about to happen. This was phase 1 of the storm called “overrunning snow.”
Mid-Atlantic Radar (12:45 am on Sun) Nice mesoscale banding taking place. Phase 2 of the storm (storm snow). Very intense rates of storm snow getting ready to transition into phase 3 of wrap around snow due to upper air energy transfer to the coast.
Local Radar (1:36 am on Sunday) • This was a lot of fun to watch at this point. The best was still yet to come. Storm snow here about to transition into wrap around snow. Thunder snow very common at this time. Convective banding shown by alternating bands of dark green, light green, and blue.
Radar (2am on Sunday) Everything was working together at this point. High Pressure, track of surface low, energy transfer, dynamics, upper air pattern etc. Thunder snow very common at this point along I-95 corridor.
Local Radar (4:54 am on Sunday) • Best burst yet to come. Banding working southeast. Chester County, PA was really getting it now. Nice snow to liquid ratios there. Phase 3 of wrap around snow working very well.
Visible Satellite (7:45 am on Sunday) • Most intense snows to the north and west of eye. Surface low and upper air energy very consolidated, thus the eye like feature.
Visible Satellite (8 am on Sunday) • Dynamic interaction between upper level and surface low creates eye like feature. “Isn’t she lovely, isn’t she beautiful.”
Storm Snowfall Totals • Abington, Pennsylvania within the heaviest stripe of snow. Not quite as good as NYC though but very satisfying to the snow goose appetite.
Storm Snowfall Totals Maximum snowfalls in Chester, Montgomery, and Bucks counties. I said it was a 1 in 25 shot on Friday morning for us to get this type of result. The same odds the Eagles have at winning the Super Bowl next season. Perhaps this is an omen.