Download
1 / 28
280 likes | 288 Views
U.S. aerosols: observation from space, interactions with climate. Daniel J. Jacob. with Easan E. Drury, Loretta J. Mickley, Eric M. Leibensperger, Amos Tai. and funding from NASA, EPRI, EPA. a revolution over the past decade. SATELLITE OBSERVATIONS OF TROPOSPHERIC COMPOSITION:.

E N D
U.S. aerosols: observation from space, interactions with climate Daniel J. Jacob with Easan E. Drury, Loretta J. Mickley, Eric M. Leibensperger, Amos Tai and funding from NASA, EPRI, EPA
a revolution over the past decade SATELLITE OBSERVATIONS OF TROPOSPHERIC COMPOSITION: Integrated observing system The NASA “A-Train” Satellites Models aircraft, ships, sondes, lidars Surface sites • Principal tropospheric species measured from space: • Ozone , NO2, formaldehyde, BrO, glyoxal • CO, CO2, methane • Aerosols, SO2
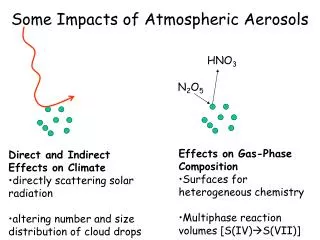
number AEROSOL CHARACTERISTICS area Typical size distribution (Seinfeld and Pandis, 1998) PM2.5 (EPA std.) volume Chemical composition of PM2.5 (NARSTO, 2004) sulfate (coal combustion) nitrate (fossil fuel combustion) ammonium (agriculture) black carbon (combustion) organic carbon (combustion, vegetation) soil other
EARTH HOW TO OBSERVE AEROSOLS FROM SPACE? Solar occultation (SAGE, POAM…) Active system (CALIPSO…) Solar back-scatter (MODIS, MISR…) laser pulse Surface Surface Pros: high S/N, vertical profiling Cons: sparse sampling, cloud interference, low horizontal resolution Pro: vertical profiling Con: sparse sampling Pro: horiz. resolution Con: daytime and column only
Aerosol observation from space by solar backscatter Easy to do qualitatively for thick plumes over ocean… California fire plumes Pollution off U.S. east coast Dust off West Africa …but difficult quantitatively! Fundamental quantity is aerosol optical depth (AOD) Il () Measured top-of-atmosphere reflectance = f (AOD, aerosol properties, surface reflectance, air scattering, gas absorption, Sun-satellite geometry) aerosol scattering, absorption Il (0)=Il()exp[-AOD]
Aerosol optical depths (AODs) measured from space Jan 2001 – Oct 2002 operational data MODIS (c004) return time 2x/day; nadir view known positive bias over land 550 nm AODs MISR 9-day return time; multi-angle view better but much sparser van Donkelaar et al. [2006]
MODIS OPERATIONAL RETRIEVAL OVER LAND • Use top-of-atmosphere (TOA) reflectance • at 2.13 mm (transparent atmosphere) to derive surface reflectance • Assume fixed 0.47/2.13 and 0.65/2.13 surface reflectance ratios to derive atmospheric reflectances at 0.47 and 0.65 mm by subtraction • Assume generic aerosol optical properties to convert atmospheric reflectance to AOD • MISR does along-track multi-angle viewing of same aerosol column – better constraints but sparser data TOA reflectance 0.47 mm 0.65 mm 2.13 mm SURFACE Y. Kaufman, L. Remer, and MODIS Science Team
IMPROVING THE MODIS AEROSOL RETRIEVALUSING ICARTT AIRCRAFT DATA OVER US (Jul-Aug 2004) fit AODs synthetic TOA reflectance = f(AOD,…) MODIS satellite instrument: TOA reflectance NASA, NOAA, DOE aircraft: speciated mass concentrations, microphysical & optical properties GEOS-Chem model evaluate MODIS local surface reflectance and ratio NASA DC-8 EPA AQS/IMPROVE surface networks: mass concentrations NASA AERONET surface network: AODs EASTERN U.S. Drury et al. [JGR 2008, in prep]
IMPROVING THE SURFACE REFLECTANCE CORRECTION FOR MODIS AEROSOL RETRIEVALS 0.65 mm 2.13 mm Measured top-of-atmosphere (TOA) reflectances (ICARTT period) 0.65/2.13 surface reflectance ratio Measured 0.65 vs. 2.13 TOA reflectances: take lower envelope for given location to derive surface reflectance ratio Fresno, CA ICARTT period Derive aerosol reflectance at 0.65 mm (same procedure for 0.47 mm) Drury et al. [JGR 2008]
CONVERTING TOA AEROSOL REFLECTANCES TO AODs Standard MODIS algorithm assumes generic aerosol optical properties Better way is to use local info for given scene from a global 3-D aerosol model • Use GEOS-Chem model driven by NASA/GEOS assimilated meteorological data with 2ox2.5o resolution • Model simulates mass concentrations of different aerosol types • Size distributions and optical properties for different aerosol types are assumed (test with ICARTT data) • Calculate TOA reflectances from model fields to compare with MODIS • Consistency of aerosol optical properties enables subsequent model evaluation with observed MODIS AODs
Annual mean concentrations at IMPROVE sites (2001) – CASTNET for NH4+ PREVIOUS MODEL EVALUATION: sulfate-nitrate-ammonium r = 0.96 bias = +10% r = 0.60 bias = +30% r =0.94 bias = +10% • Sulfate is 100% in aerosol; • Ammonia NH3(g) neutralizes sulfate to form (NH4)2SO4; • Excess NH3(g) if present can combine with HNO3(g) to form NH4NO3 • as function of T, RH Park et al. [AE 2006]
Elemental carbon (EC) Organic carbon (OC) Annual mean concentrations at IMPROVE sites (2001) PREVIOUS MODEL EVALUATION: carbonaceous aerosol r = 0.75 bias = -15% r = 0.70 bias = +20% • Primary sources: fossil fuel, biofuel, wildfires • Also large growing-season biogenic source of secondary organic aerosol (SOA) volatile organic compounds (VOCs) oxidation, multi-step SOA Park et al. [AE 2006]
GEOS-Chem PREVIOUS MODEL EVALUATION: mineral dust Annual mean concentrations at IMPROVE sites (2001) Asian dust Saharan dust Local Fairlie et al. [AE 2007]
AEROSOL VERTICAL PROFILES IN ICARTT IMPROVE (<2.5 mm) bulk filter (Dibb, UNH) NASA DC-8 PILS (Weber, GIT) • Sulfate model overestimate: excessive cloud processing? • Unresolved issue with aircraft dust observations at low altitude Easan Dury, in prep.
ORGANIC AEROSOL IN ICARTT PILS water-soluble organic carbon (WSOC) on NOAA P-3 IMPROVE measurements of organic carbon Fu et al. (AE, 2009) • Standard reversible SOA (Pankow/Seinfeld): • Dicarbonyl SOA (Liggio/Fu):
MEAN AEROSOL VERTICAL PROFILES IN ICARTT • Bulk of mass is in boundary layer below 3 km: mostly sulfate, organic • Dust, organic dominate above 3 km Easan Drury, in prep.
AEROSOL OPTICAL PROPERTIES IN ICARTT Single-scattering albedo = fraction of aerosol extinction due to scattering standard model assumption (GADs) improved fit (this work) AERONET Easan Drury, in prep.
MEAN AEROSOL OPTICAL DEPTHS DURING ICARTT Model results compared to observations from AERONET network (circles) Model w/ GADs size distributions Model w/improved size distributions r = 0.89 bias = -21% r = 0.89 bias = -7% Main improvement was to reduce the geometric standard deviation in the log-normal size distributions for sulfate and OC from 2.2 to 1.6 Easan Drury, in prep.
GEOS-Chem model MODIS (this work) MODIS (c004) MODIS (c005) AEOSOL OPTICAL DEPTHS (0.47 mm), JUL-AUG 2004 c004 and c005 are the MODIS operational data; AERONET data are in circles • Beyond improving on the operational products, our MODIS retrieval enables quantitative comparison to model results (consistent aerosol optical properties) • Results indicate model underestimate in Southeast US – organic aerosol Drury et al., in prep.
EPA AQS surface network data MODIS PM2.5 (this work) Can we use AODs measured from space as proxy for PM2.5? Infer PM2.5 from AOD by Drury et al. [in prep] Sulfate observations in Pittsburgh (Wittig et al. 2004) Bias in source regions could be partly due to PM2.5 diurnal cycle: MODIS
RADIATIVE FORCING OF CLIMATE BY AEROSOLS Globally averaged radiative forcing due to CO2 is +1.7 Wm-2 Liao et al. , 2004 Over eastern US, radiative forcing due to sulfate aerosols is -2 Wm-2 IPCC (2007) US sulfur emissions are decreasing rapidly: what are the impacts on the regional climate? today
CALCULATING THE CLIMATE RESPONSE FROM SHUTTING DOWN U.S. AEROSOL GISS GCM Consider two scenarios: Control: aerosol optical depths fixed at 1990s levels. Sensitivity: U.S. aerosol optical depths set to zero (radiative forcing of about +2 W m-2 over US) Conduct ensemble of 3 simulations for each scenario. Mickley et al. (in prep.)
Removal of anthropogenic aerosols over US leads to a 0.5-1o C warming in annual mean surface temperature. Additional warming due to zeroing of aerosols over the US. Warming due to 2010-2025 trend in greenhouse gases. Annual mean surface temperature change in Control. Mean 2010-2025 temperature difference: No-US-aerosol case – Control White areas signify no significant difference. Results from an ensemble of 3 for each case. Mickley et al., in prep.
Annual mean temperature trends over Eastern US No-US-aerosols case Temperature (oC) Control, with US aerosols Regional surface temperature response to aerosol removal is a persistent effect Mickley et al., in prep.
2000-2050 change of 8-h daily max ozone in summer, keeping anthropogenic emissions constant ppb Northeast Midwest California Texas Southeast EFFECT OF FUTURE CLIMATE CHANGE ON US AIR QUALITY Models show consistent increase of ozone, mainly driven by temperature Results from six coupled GCM-CTM simulations Weaver et al. [BAMS, submitted] …but model results for aerosols show no such consistency, including in sign. How can we progress?
AEROSOL CORRELATION WITH METEOROLOGICAL VARIABLES Multilinear regression model fit to 1998-2008 deseasonalized EPA/AQS data for PM2.5 (total and speciated) mostly precipitation mostly temperature and stagnation R2 R2 fit Tai et al. [in prep.]
TEMPERATURE COEFFICIENTS FOR SPECIATED PM2.5 Positive association of nitrate with temperature in California could be driven by ammonia emissions Tai et al. [in prep.]
WIND VECTOR COEFFICIENTS FOR SPECIATED PM2.5 Tai et al. [in prep.]