Download
1 / 38
410 likes | 478 Views
5 Whys & Fishbone Diagramming. June 11, 2013. Slide File Location. Ccmlean / Leanboosting / A3_Mini-Kaizen / A3 Toolbox / Problem Solving Toolkit / Fishbone Mini-Kaizen. “When do we use 5-Whys?”.

E N D
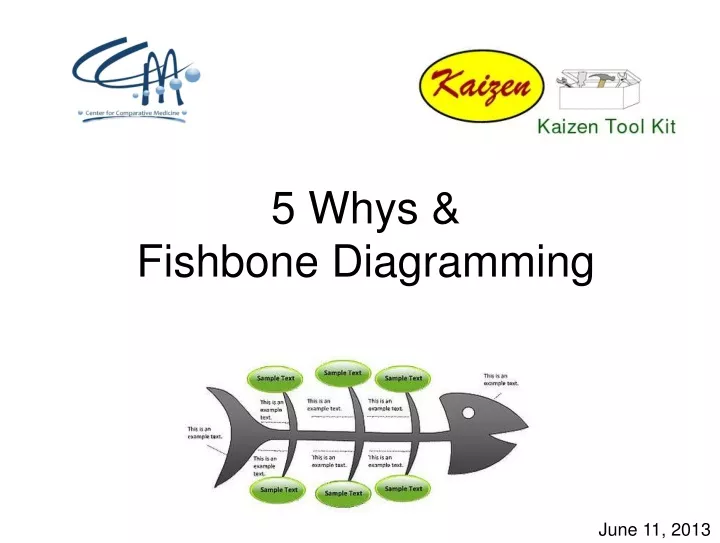
5 Whys &Fishbone Diagramming June 11, 2013
Slide File Location • Ccmlean / Leanboosting / A3_Mini-Kaizen / A3 Toolbox / Problem Solving Toolkit / Fishbone Mini-Kaizen
“When do we use 5-Whys?” • When drilling into a problem to determine root cause, “5-Why analysis” is the best place to start. • For simple problems the 5-Whys may suffice. • Teams often discover that there are multiple cause for even a simple problem. • The fishbone allows a team to visualize and categorize those problems for further r analysis “When do we use a fishbone?”
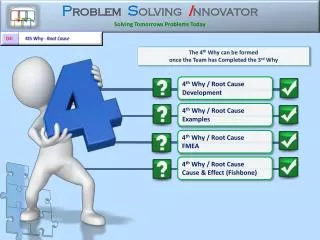
5 Why Analysis Problem Identification: What’s the problem/failure? Where does it occur? When does it occur? How does it occur? • Cons: • Stakeholders not always involved • Not data driven, not repeatable • Easy to bias results ... • Relies on personal experience... • -go and investigate...go and see • Doesn't account for multiple cause factors: Use fishbone • Non-data analysis of simple issues, • -important problems need data analysis Ask: “Why did that occur?” Then ask: “Why did that occur?” Cascade deeper to the root cause Logic check: For each “Why” listed, Go backwards and ask “does this cause” the “Why” above? • Pros: • Easy to use • Introduces problem solving methods • Prevents band-aid solutions (rush to judgment)
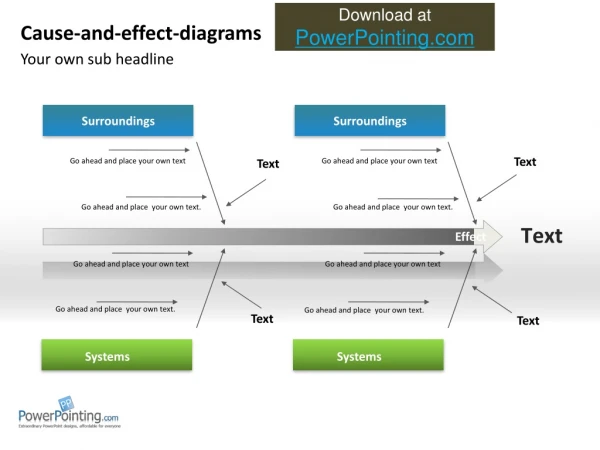
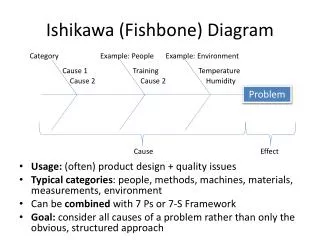
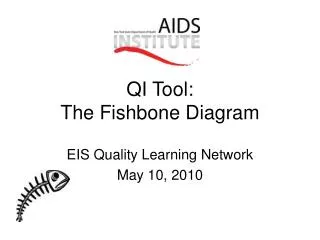
What is a Fishbone diagram? • Fishbone diagram is an analysis tool to provide systematic way of understanding effects and the causes that create those effect. • The design of the diagram looks like the skeleton of a fish hence, it is referred to as the fishbone diagram. • Dr. Kaoru Ishikawa, a Japanese quality control statistician, invented the fishbone diagram. • Referred to as the Ishikawa diagram • Referred to as a cause-and-effect diagram. • Fishbone diagram is a great value in assisting teams in categorizing the many potential causes of problems or issues in a systematic way and helps identifying root causes.
A Fishbone is used when… • The team needs to study a problem to determine the root cause • Want to study all the possible reasons why a process is having difficulties, problems, or breakdowns in the initial stages of the process. • Need to identify areas for data collection • To study why a process is not performing properly and/or producing the expected results
Step 1: “Plan” Identify problem Investigate root cause Select appropriate countermeasures Step 2: “Do” Implement countermeasures Step 3: “Check” Study the Results Step 4: “Act” Standardize and Plan Continuous Improvement PDCA Steps
The Fishbone in the Problem-Solving Sheet Why Why Why Why Why
Creating a Fishbone • On the Problem-solving sheet or VPP Board, draw a fishbone skeleton diagram with a head and up to 6 “bones” (pencil recommended) • List the “problem/issue” to be studied in the head of the fish • List the “target state” you wish to achieve above the fish-head • If applicable, list the metrics you wish to see improved or reduced in the box below the fish-head (8-wastes: time, dollars, steps, attendance, space, interruptions,)
“Methods” Is there a process? Was it developed by a team? Process clear & easy to follow? Process change? Are things properly labeled? Workers trained? Safety and prevention in the process? “Machines” Correct tools? Is Equipment functioning as required? Is the equipment safe? “Materials” Information available/up to date? Proper materials? Available? Were substitutes used? Material defective? Handled properly/safely/improperly? Supplier process and ordering defined? Contamination possible? “Manpower” Experience Process consistency Workload capability Fatigue / stress / task management / judgment “Measurement” Are measuring methods accurate? Do measurements differ from Staff member to Staff member? Does environment effect measurement? “Mother Nature”/”environment”; Process affected by temperature? Noise, humidity, temperature (“Management” optional). 5) Labeling the “Bones” (categorize and document all possible causes)Label each bone of the fish. The major categories typically used are:
Materials Methods Machines Target Fishbone Worksheet Problem Metric Measurement Mother Nature (environment) Manpower Cause Effect Management (optional)
Red = new problem? Bold = assumption? Materials Methods Machines Boxes received with and without bedding Stock not rotated Target All Boxes have gels that are within expiration date Brainstorming Causes Boxes received expired Different stacking methods Ordering Boxes Live rodent boxes found mixed in empty box delivery Problem Transport Boxes have expired Gel Gel may be expiring in CCM Random people sign for Boxes Metric 3 months, no defects zero time to rework Measurement Mother Nature (environment) Manpower Cause Effect Management (optional)
Prioritizing Causes • As a team, review all the potential causes on the fishbone. • Eliminate those causes that: • You may not be able to control or influence • You determine not worth investigating further • Identify and focus on those causes that: • You can control, change or influence • If you need leadership assistance, discuss this with your manager • Prioritize Causes: • Grade the cause using a 1 through 5 scale: • 5 = High priority (high impact / low cost) • 1 = Low priority (low impact / high cost)
Red = new problem? Bold = assumption? Materials Methods Machines 1 1) Boxes received with and without bedding 5 5) Stock not rotated Target All Boxes have gels that are within expiration date Brainstorming Causes Boxes received expired 5 5) Different stacking methods Ordering Boxes 5 5) Live rodent boxes found mixed in empty box delivery Problem Transport Boxes have expired Gel Gel may be expiring in CCM 4/5 4/5?) Random people sign for Boxes Metric 3 months, no defects zero time to rework Measurement Mother Nature (environment) Manpower Cause Effect Management (optional)
Brainstorming Countermeasures • Gather and record all potential countermeasures and solutions from all team members. • Seek Total Employee Engagement • Brainstorm countermeasures that: • Will eliminate the problem (high impact) • Do not cost time or money to implement (low cost) • Check in with your manager to review the causes and countermeasures and for approval to proceed • If needed, grade the countermeasure by using a 1 through 5 scale: • 5 = High priority (high impact / low cost) • 1 = Low priority (low impact / high cost) • Identify actions needed to implement countermeasures • Request volunteers to take on Action items • Assign appropriate staff to take on Action Items • Determine which countermeasure(s) are the most appropriate, most feasible, and least complex to implement.
Countermeasure “Sorting”Affinity Diagram High 5 2 8 7 6 Arrange the countermeasures In accordance to their: Impact: Low > High Cost & Difficulty: Low > High 4 9 Impact 13 1 10 Low Low High Cost / Difficulty
Fishbone Review Fishbone diagrams are most useful when interactive and everyone is participating. If multiple problems are identified using the Fishbone, some problems may be “Just do it”s, some may be more complex and additional Problem-solving sheets may be required. Sometimes, fishbone diagrams should remain in public view to allow team members to add to it over time as they discover new causes.
Conducting a Formalized Fishbone Session • For use with larger teams in a “meeting” setting • 5 or more participants • Mini-kaizen problem-solving event • For complex problems • Multiple stakeholders • Multiple complex causes • Use to promote engagement by all team members • Total Employee Engagement
Fishbone Diagram Instructions: Drawing ideas from the Team • “Fish head”: Identify & record the “Problem” you are trying to solve • Ie: Billy is always late for work • Target box: what is the goal? Ie: on-time every day, zero defects, zero injuries, 50% reduction in space • Metric box: how will you measure? • Ie: attendance records, time, dollars, square footage • “Fish bones”: categorize (affinitize) the causes ie: • man, • materials, • methods, • machines, • measurements, mother earth • (White Board Analysis): IN SILENCE, on a single color sticky-note, each member of the team will write down all of the “causes” based on fact and hand your causes to the Team leader. 2 4 1 3 5
Manpower Method 6) Together with the Team, the Team Leader will post the cause sticky-notes to the left of the fishbone in the 6 categories from step 4. Similar causes will be posted on top of each other. Target 6 Machine Cause Cause Cause Cause Cause Problem Cause Cause Cause Cause Cause Metric Cause Mother nature Material Measure
Manpower Method Machine 7) “5-Whys”Identify Causes that need further analysis. Conduct the “5-Whys” to determine their root cause.Identify causes that are beyond your control, and you can not change Target 7 Cause Cause Why Why Why Why Why Why Why Why Why Why Cause Cause Problem Cause Cause Cause Cause Cause Metric Cause Mother nature Material Measure
8) Once all causes have been posted, use a different color sticky-note, and together with the team, the Team Leader will write countermeasures for each cause and post the sticky-note to the right of the right of the cause. 8 Manpower Method Target Machine Cause Countermeasure Countermeasure Cause Cause Countermeasure Cause Countermeasure Cause Countermeasure Problem Cause Countermeasure Cause Cause Countermeasure Cause Countermeasure Cause Countermeasure Metric Cause Countermeasure Mother nature Material Measure
9. Each countermeasure will be marked 1, 2, 3, 4…etc. 1 9 2 3 8 4 10 7 5 6
Countermeasure “Sorting”Affinity Diagram High 5 2 8 7 6 10. Arrange the countermeasures In accordance to their: Impact: Low > High Cost & Difficulty: Low > High 4 9 Impact 13 1 10 Low Low High Cost / Difficulty
11. Determine the quadrant where you should focus on in your proposal These countermeasures should be in your plan High 5 2 8 7 6 4 9 Impact 13 1 10 Low Low High Cost / Difficulty
Fishbone Review • Fishbone diagrams are most useful when interactive and everyone is participation. • While not a requirement, using post-its allow even the most reserved Team members to participate in a non-judgmental way. • If multiple problems are identified using the Fishbone, some problems may be “Just do it”s, some may be more complex and additional Problem-solving sheets may be required. • Sometimes, fishbone diagrams should remain in public view to allow team members to add to it over time as they discover new causes.
Machines Methods Materials Target Fishbone Mechanics Problem Metric Measurement Mother Nature Manpower
Waste Removal Improvement Ideas • Is this a problem on our site?qYes qNo qIn the future
Break • Additional material (do not print)
Affinity (similarity) Diagram • An affinity diagram is used to organize a large amount of language data into groupings based on natural relationships between each item. It is created with the following steps: • Record on “post-its” • Develop data dictionary of needs. • Eliminate obvious redundancy & re-state. • Spread “post-its” on wall. • As a team, look for two items that seem related in some way and move cards together. Continue to organize cards into groupings that are related. • Select card or create statement that captures the meaning of the grouping. • Eliminate redundancy & re-state
Pareto Chart Refer to “Pareto Chart File” location
Total Employee Engagement (TEE)Mini Kaizen Instructions • Team Name: Complete this block identifying all the stakeholders involved. • 8 Wastes & Safety: identify one or more of the Wastes and/or Safety you are addressing with this Mini-Kaizen. Gather current state data to understand the problem or Waste today. • Background: give a brief description of the current condition that has been identified for improvement. • Problem Description: Describe the problem that was identified by the team. • Current Picture: in addition to current state data, add a photo of the current state. • Interim Containment Measures: Emergent steps taken to prevent further injury, waste, outbreaks, etc. • Project Goal: describe the goal of your Team with metrics of the desired project outcome • (example: our team seeks to reduce time to ___by X; eliminate unnecessary steps ___ by X, decrease supply use of _____ by X, etc). • Root Cause Analysis: Illustrate the method used by your team demonstrating how they arrived at the root cause. • Countermeasures considered: what ideas were tested by the Team; 2-4 countermeasures must be evaluated. • Countermeasures Implemented: based on your tests, which countermeasure(s) was selected by the team, and why. • Results of the Mini-Kaizen: Demonstrate the quantitative or qualitative outcome of the Kaizen. • (example: Actual Time saved = _______: Actual Supplies saved = ________; Actual dollars saved = _______; etc) • After Picture: Add a photo, graph or diagram of the project or outcome with the improvements in-place. • Follow-up action: any additional tasks required to validate the improvement or are needed for further improvements. • Knowledge Sharing: share this improvement with other Facility Managers and team Leads to determine if the improvement can be applied to other facilities; quantify the improvement in all facilities. • Recognition & Documentation: TEE Kaizens must be presented and approved to the Lean Steering Committee to receive full credit to your facility. Make sure all support documentation is present, and other facilities have been contacted to maximize the benefit potential of the Kaizen. Use the reverse side of the plaque for additional details if necessary.
Total Employee Engagement Kaizen PlaqueProject Name Here Improving CCM…Improving Scientific Breakthroughs • 1)Team Name: • Date: • Creator’s Name: • Team Members/stakeholders: • _ • _ • _ 5) Current State Picture 3) Background: 4) Problem Description: 6) Interim Containment Measures: 7) Project Goal/Customer-focused Future State: 8) Root Cause Analysis: 9) Countermeasures Considered: a) b) c) 10) Countermeasure Implemented: 12) Results of this Kaizen: (Improvement / $ savings / safety / error reduction / time saved, customer satisfaction etc) 13) Follow-up action: 2) 8 Wastes Check all that apply: pDefects: (rework/parts/data) pOverproduction:(Making more than customer demand) pWaiting:(for machines / material / people / data) pNeglected Employee Creativity pTransportation/Movement: (any type / anywhere) pInventory (storage) (work-area, aisle, stockroom) pMotion:(searching / reaching / walking) pExtra processing:(strain / redundant / unnecessary) pSafety(ergonomics, injury, animal welfare) Photo or diagram of analysis used; 5-Whys, fishbone, affinity diagram, Pareto chart 11) Improvement Picture Have all facilities been involved to maximize the benefits of this project? Yes No
Total Employee Engagement Kaizen PlaqueProject Name Here Improving CCM…Improving Scientific Breakthroughs • Team Name: • Date: • Creator’s Name: • Team Members/stakeholders: • _ • _ • _ 5) Current State Picture • Problem Description: • Background & Current State • Project Goal / Future State 2) Countermeasures Details: • Root Cause Analysis • Countermeasures Implemented 3) Results of this Kaizen: (Measurable Improvements) • Safety • $avings • Time saved • Error reduction • Customer satisfaction etc) 4) Follow-up action: 8 Wastes + Safety Check all that apply: pDefects: (rework/parts/data) pOverproduction:(Making more than customer demand) pWaiting:(for machines / material / people / data) pNeglected Employee Creativity pTransportation/Movement: (any type / anywhere) pInventory (storage) (work-area, aisle, stockroom) pMotion:(searching / reaching / walking) pExtra processing:(strain / redundant / unnecessary) pSafety(ergonomics, injury, animal welfare) Photo or diagram of analysis used; 5-Whys, fishbone, affinity diagram, Pareto chart 6) Improvement Picture Have all facilities been involved to maximize the benefits of this project? Yes No
Creating a Fishbone • Draw a fishbone skeleton diagram • List the problem/issue to be studied in the head of the fish • Label each bone of the fish. The major categories typically used are: • Methods: Correct tools? • Machines, • Materials, • Manpower, • Measurement, • Mother Nature • (“Management” optional). • Analyze the results of the fishbone after team members agree that an adequate amount of detail has been provided under each major category. Do this by looking for those items that appear in more than one category. These become the ‘most likely causes”. • For those items identified as the “most likely causes”, the team should reach consensus on listing those items in priority order with the first item being the most probable” cause.
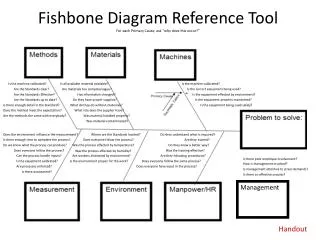
Fishbone Diagram Reference ToolFor each Primary Cause, ask “why does this occur?” Is the machine calibrated? Is all available material available? Is the machine calibrated? Are the Standards clear? Are materials too complex/vague? Is the correct equipment being used? Are the Standards Effective? Has information changed? Is the equipment effected by environment? Are the Standards up to date? Do they have proper supplies? Is the equipment properly maintained? Is there enough detail in the Standard? What do they do without materials? Is the equipment being used safely? Does the method meet the expectation? What role does the supplier have? Are the methods the same with everybody? Was material handled properly? Was material contaminated? Does the environment influence the measurement? Where are the Standards located? Do they understand what is required? Is there enough time to complete the process? Does everyone follow the process? Are they trained? Do we know what the process can produce? Was the process effected by temperature? Do they know a better way? Does everyone follow the process? Was the training effective? Was the process effected by humidity? Can the process handle inputs? Are workers distracted by environment? Are they following procedures? Is there poor employee involvement? Is the equipment calibrated? Is the environment proper for the work? Does everyone follow the same process? How is management involved? Are processes enforced? Does everyone have input in the process? Is management attentive to stress demands? Is there assessment? Is there an effective process? Management Handout