Download
1 / 15
150 likes | 158 Views
Basics:. Notation:. Sum:. PARAMETERS. * the statistical average * the central tendency * the spread of the values about the mean. MEAN: Sample Variance: Standard Deviation:. Covariance.

E N D
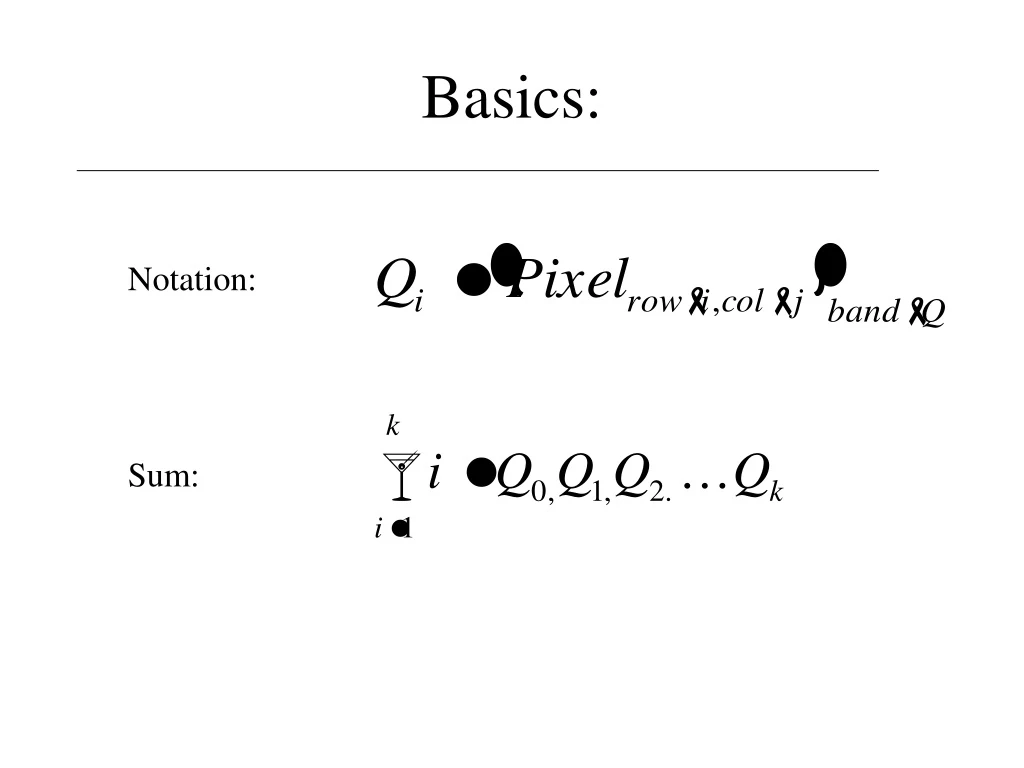
Basics: Notation: Sum:
PARAMETERS * the statistical average * the central tendency * the spread of the values about the mean MEAN: Sample Variance: Standard Deviation:
Covariance * measures the tendencies of data file values for the same pixel, but in different bands, to vary with each other in relation to the means of their respective bands.
Dimensionality N = the number of bands = dimensions …. an (n) dimensional data (feature) space Measurement Vector Mean Vector Feature Space - 2dimensions 190 85 Band B Band A
Spectral Distance * a number that allows two measurement vectors to be compared
terms • Parametric = based upon statistical parameters (mean & standard deviation) • Non-Parametric = based upon objects (polygons) in feature space • Decision Rules = rules for sorting pixels into classes
ISODATA I - iterative S - self O - organizing D - data A - analysis T - technique A - (application)? ClusteringMinimum Spectral Distance - unsupervised Band B Band A Band B Band A 1st iteration cluster mean 2nd iteration cluster mean
Classification Decision Rules • Non-Parametric • parallelepiped • feature space • Unclassified Options • parametric rule • unclassified • Overlap Options • parametric rule • by order • unclassified • Parametric • minimum distance • Mahalanobis distance • maximum likelihood • If the non-parametric test results in one unique class, the pixel will be assigned to that class. • if the non-parametric test results in zero classes (outside the decision boundaries) the the “unclassified rule applies … either left unclassified or classified by the parametric rule • if the pixel falls into more than one class the overlap rule applies … left unclassified, use the parametric rule, or processing order
cluster mean Candidate pixel Parallelepiped • Maximum likelihood • (bayesian) • probability • Bayesian, a prior (weights) Band B Band A Minimum Distance Band B Band A
GeoStatistics • Univariate • Bivariate • Spatial Description
Univariate • One Variable • Frequency (table) • Histogram (graph) • Do the same thing (i.e count of observations in intervals or classes • Cumulative Frequency (total “below” cutoffs)
Summary of a histogram • Measurements of location (center of distribution • mean (m µ x ) • median • mode • Measurements of spread (variability) • variance • standard deviation • interquartile range • Measurements of shape (symmetry & length • coefficient of skewness • coefficient of variation
Bivariate Scatterplots Correlation Linear Regression slope constant
* Xj,Yj tj hij=tj-ti * Xi,Yi * ti (0,0) Spatial Description - Data Postings = symbol maps (if only 2 classes = indicator map - Contour Maps - Moving Windows => “heteroscedasticity” (values in some region are more variable than in others) - Spatial Continuity (h-scatterplots Spatial lag = h = (0,1) = same x, y+1 h=(0,0) h=(0,3) h=(0,5) correlation coefficient (i.e the correlogram, relationship of p with h
moment of inertia = • Correlogram = p(h) = the relationship of the correlation coefficient of an h-scatterplot and h (the spatial lag) • Covariance = C(h) = the relationship of thecoefficient of variation of an h-scatterplot and h • Semivariogram = variogram = = moment of inertia OR: half the average sum difference between the x and y pair of the h-scatterplot OR: for a h(0,0) all points fall on a line x=y OR: as |h| points drift away from x=y