Download
1 / 26
260 likes | 262 Views
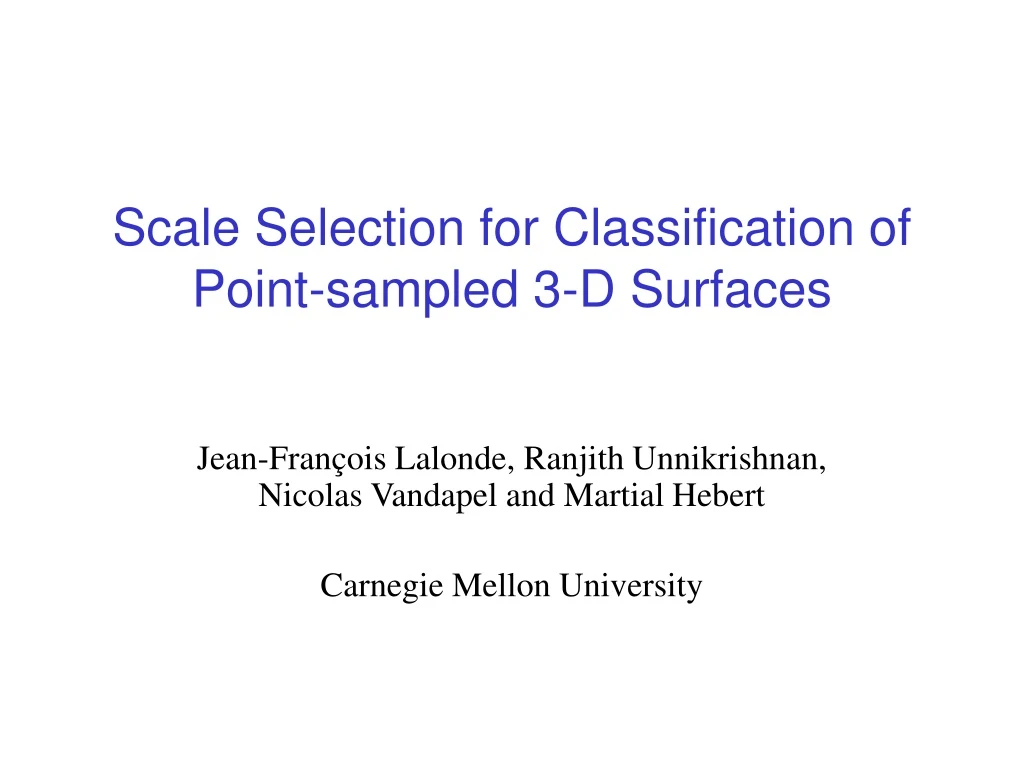
Scale Selection for Classification of Point-sampled 3-D Surfaces. Jean-François Lalonde, Ranjith Unnikrishnan, Nicolas Vandapel and Martial Hebert Carnegie Mellon University. Processing of large 3-D point cloud data from ladar. Problem. Terrain classification

E N D
Scale Selection for Classification of Point-sampled 3-D Surfaces Jean-François Lalonde, Ranjith Unnikrishnan, Nicolas Vandapel and Martial Hebert Carnegie Mellon University
Processing of large 3-D point cloud data from ladar Problem 3DIM 2005
Terrain classification Through local processing [Vandapel-ICRA04] vegetation linear surface Example 3DIM 2005
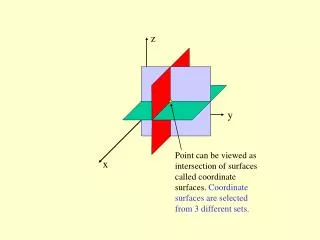
Local computation on 3-D point sets Point of interest Scan through all points in the dataset Support region Local computation on highlighted points 3DIM 2005
Local computation on 3-D point sets Point of interest Scan through all points in the dataset Scale Radius of support region Support region Local computation on highlighted points 3DIM 2005
Terrain classification • Compute scatter matrix within support region • Extract principal components • Features are linear combination of eigenvalues [Tang-PAMI04] • Train a GMM classifier on hand-labelled data using EM • Classification: maximum likelihood class • Scale is fixed Scatter Planar Linear 3DIM 2005
Problems with fixed scale 3DIM 2005
Problems with fixed scale High density Low density 3DIM 2005
What is the best support region size? • Scale theory well-known in 2-D [Lindeberg-PAMI90, Lindeberg-JAS94] • No such theory in 3-D • some methods exist [Tang-ICRA04, Pauly-Eurographics03] 3DIM 2005
Approach • Focus analysis to surfaces • Larger source of errors • Closely related to normal estimation • Extend method for optimal scale selection for normal estimation [Mitra-IJCGA05] [Mitra-IJCGA05] N. Mitra, A. Nguyen and L. Guibas, Estimating surface normals in noisy point cloud data. Intl. Journal of Computational Geometry and Applications (to appear), 2005. 3DIM 2005
known unknown Optimal scale selection for normal estimation [Mitra-IJCGA05] • Analytic expression for optimal scale r Estimated scale k Estimated local curvature* sn Sensor noise r Estimated local density * Curvature estimation from [Gumhold-01] 3DIM 2005
Algorithm [Mitra-IJCGA05] • Initial value of k=k(i) nearest neighbors • Iterative procedure • Estimate curvature k(i) and density r(i) • Compute r(i+1) • k(i+1) is number of points in neighborhood of size r(i+1) iteration i 3DIM 2005
Algorithm [Mitra-IJCGA05] • Works well for • Minimum spatial density (no holes) • No discontinuities • Small noise and curvature • Real-world data • High density variation • Holes • Unbounded curvature • Discontinuities, junctions dense, complete 3-D models Ladar data 3DIM 2005
Real-world data, normal estimation Avg. error = 22 deg. 3DIM 2005
Real-world data, convergence Avg. error = 22 deg. Scale (m) Iteration 3DIM 2005
Proposed algorithm • Initial value of k=k(i) • Iterative procedure • Estimate curvature k(i) and density r(i) • Compute r(i+1) • kcomputed is number of points in neighborhood of size r(i+1) • Dampening on k: g Dampening factor 3DIM 2005
Effect of dampening on convergence With dampening Original method (no dampening) Scale (m) Scale (m) Iteration Iteration 3DIM 2005
Effect of dampening on normal estimation With dampening Original method (no dampening) Avg. error = 22 deg. Avg. error = 12 deg. 3DIM 2005
Variation of density • Data subsampled for clarity • Normals estimated from support region • Scale determined by the algorithm y x 3DIM 2005
Classification experiments • SICK scanner Variable scale at each point Fixed scale (0.4 m) • 0.4m best fixed scale, determined experimentally • Improvement of 30% for previously misclassified points 3DIM 2005
Classification experiments • SICK scanner Fixed scale (0.4 m) Variable scale at each point 3DIM 2005
Classification experiments • RIEGL scanner Variable scale at each point Fixed scale (0.4 m) 3DIM 2005
Classification experiments • RIEGL scanner Variable scale at each point Fixed scale (0.4 m) 3DIM 2005
Classification experiments • RIEGL scanner Variable scale at each point Fixed scale (0.4 m) 3DIM 2005
Conclusion • Problem • Terrain classification errors due to fixed scale • Contributions • Assumptions • Minimum spatial density • No discontinuities • Small curvature • Improves convergence / reduce oscillations • Apply variable scale to classification • Extensive experimental verification shows 30% improvement • Limitations • Points misclassified regardless of scale 3DIM 2005
Conclusion • Acknowledgements • General Dynamics Robotics Systems • U.S. Army Research Laboratory Thank you 3DIM 2005