Download

1 / 24
240 likes | 245 Views
This economic model aims to develop land use scenarios with associated limits and targets for water quality. By integrating diverse processes and dealing with multiple contaminants, the model provides key outputs such as the cost of targets, helping to understand the limitations and requirements for achieving water quality goals.

E N D
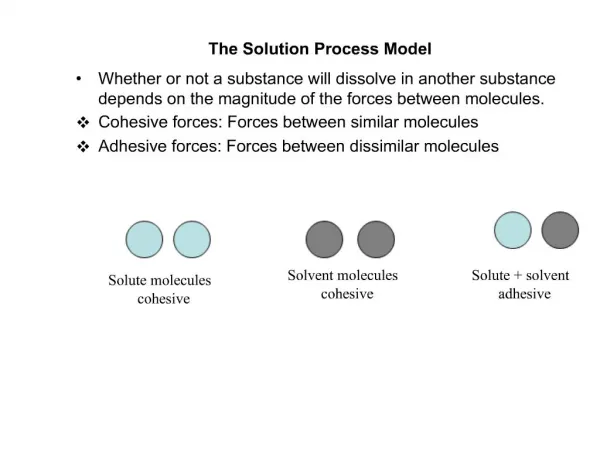
Economic model for the Healthy Rivers process Graeme Doole Technical Leaders Group
Development of limits and targets • Develop a number of land use scenarios, with a range of associated limits and targets • Limits define the loads allowed to be placed on water quality from inputs, like nutrients and sediment • Targets define the time frames associated with reaching a given limit • Economic model will help link: • Land use → limits • Limits → land use
“The solutions to our water quality problems lie on the land, with the people.” Tony Petch
Bounds on development • Large catchment (1.1m ha) • Diverse sources • Biophysical uncertainty • Economic uncertainty • Divergent opinions • Four contaminants • Resource constraints
To achieve targets at least cost, what has to change? Land management • Land use • Intensity • Mitigation • Implications for: • Production • Profit
What are the implications of changing land use? Define land management: • Land use • Intensity • Mitigation • Implications for: • Targets • Production • Profit
Distribution of land type Catchment consists of zones based on biophysical resources and land types Cost curves Farm-level information relates cost of mitigation and resultant change in pollutant(s) in each land type Converts land use losses into sub-catchment and/or catchment water quality outcomes Hydrological model Economic modelling Identify profit and production implications of different limits on pollutant(s)
Reasons for adopting this framework • Integrate diverse processes • Deal with multiple contaminants • Simple structure aids interpretation • Provides key outputs (e.g. cost of targets) • Broad understanding of limitations • Part of the puzzle (e.g. SIA, REG)
An imaginary catchment • Assume a 2 ha catchment • 1 ha dairy currently • 1 ha sheep currently • Dairy • $2000/ha, 30 kg N/ha • $1000/ha, 20 kg N/ha • Sheep • $500/ha, 15 kg N/ha • $250/ha, 10 kg N/ha Dairy Sheep
Without a limit, what happens? • Assume a 2 ha catchment • Dairy • $2000/ha, 30 kg N/ha • $1000/ha, 20 kg N/ha • Sheep • $500/ha, 15 kg N/ha • $250/ha, 10 kg N/ha Dairy Option 1 Dairy Sheep Option 1 Sheep Profit in baseline: $2000+$500=$2500 Leaching in baseline: 30 kg + 15 kg = 45 kg
With limit of 40 kg, what happens? • Assume a 2 ha catchment • Dairy • $2000/ha, 30 kg N/ha • $1000/ha, 20 kg N/ha • Sheep • $500/ha, 15 kg N/ha • $250/ha, 10 kg N/ha Dairy Option 1 Dairy Sheep Option 2 Sheep Profit in baseline: $2000+$250=$2250 Leaching in baseline: 30 kg + 10 kg = 40 kg
With limit of 30 kg N, what happens? • Assume a 2 ha catchment • Dairy • $2000/ha, 30 kg N/ha • $1000/ha, 20 kg N/ha • Sheep • $500/ha, 15 kg N/ha • $250/ha, 10 kg N/ha Dairy Dairy Option 2 Sheep Option 2 Sheep Profit in baseline: $1000+$250=$1250 Leaching in baseline: 20 kg + 10 kg = 30 kg
What does this show? • Identify current state and alternative options • Importance of mitigation options! • Importance of current yields of contaminants • How far do we have to go? • Importance of mitigation efficacy • What will it take to reach limits? • Cost of mitigation options • Cost of meeting limits?
Abatement cost curve Cost and reduction of contaminant Area 1 Area 2 Area 3 Area 4 Area 5 Cost • Cost ↑ with level of mitigation • Curves vary: • Land use • Soil • Climate • Intensity • Abs. versus Rel. • Win-win solutions (?) Level of abatement
Abatement cost curve Examples of mitigation options Area 1 Area 2 Area 3 Area 4 Area 5 Cost • Examples: • A1: Effluent mgmt. • A2: Autumn N • A3: De-intensification • A4: Capital structures • A5: Land-use change Level of abatement
Baseline loads • Baseline loads determined for N • OVERSEER • Baseline loads determined for P → augment • OVERSEER and expert opinion • Baseline loads for sediment • SedNet • NIWA regression model • Baseline loads for E. coli • SPARROW
Mitigations • Mitigation protocol for N (DairyNZ) • Mitigation analysis for N (WRC and B & L) • Mitigation analysis for horticulture (HortNZ) • Point sources • Forestry • Mitigation workshop • P • Sediment • E. coli