Download
1 / 22
220 likes | 226 Views
Center for Health Statistics. Enumerating the Public Health (PH) Workforce. Brian King Program Director Health Professions Resource Center Center for Health Statistics Texas Department of State Health Services AUSTIN. CONTACT: brian.king@dshs.state.tx.us 512-458-7261

E N D
Center for Health Statistics Enumerating the Public Health (PH) Workforce Brian King Program Director Health Professions Resource Center Center for Health Statistics Texas Department of State Health Services AUSTIN CONTACT: brian.king@dshs.state.tx.us 512-458-7261 http://www.dshs.state.tx.us/CHS/hprc/
Center for Health Statistics U.S. Shortages Affect State Shortages “Almost 20 percent of Americans, 56 million people, have inadequate or no access to primary care physicians because of a shortage of providers, according to a report issued in March 2007 by the National Association of Community Health Centers and the American Academy of Family Physicians. Florida, Texas, and California are the hardest hit, the data show.”* 90% 70% 54% • Slide adapted presentation by Center for Health Workforce Studies, School of PH, Univ. of Albany, SUNY, “State Responses to Health Worker Shortages, 2002 Survey of States” published 11/ 2002. • *MANAGED CARE June 2007, http://www.managedcaremag.com/archives/0706/0706.shortage.html Modified by: Health Professions Resource Center, Center for Health Statistics, October 2008;
Some Geographic Locations have Greater Healthcare Needs than other Locations Center for Health Statistics Of Texas’ 254 counties: • 177 are Rural (defined by US Office of Management and Budget) • 32 are Border (counties within 100 kilometers of US/Mexico border) Poverty data from 2004 Census Bureau poverty estimates, Population data from the Texas State Data Center (2008) Prepared by: Health Professions Resource Center, December 2008 Prepared By: Health Professions Resource Center, Center for Health Statistics, Texas Department of State Health Services, May 28, 2008
Center for Health Statistics Geographic Location Ratio of Providers per 100,000 Population - 2008 Prepared by: Texas Health Professions Resource Center, Center for Health Statistics; Licensing Board Data, December 2008
Center for Health Statistics What Percentage of the Overall Health Workforce is Employed in Public Health? In 2002, public health workers were an estimated 5% of the Texas health workforce Reference: 1. “The Texas Public Health Workforce, Texas Health Workforce Planning Partnership, Texas Health Care Policy Council, June 20, 2006, Virginia C. Kennedy, Ph.D., Director, Texas Public Health Training Center. Modified by: Health Professions Resource Center, Center for Health Statistics, October 2008.
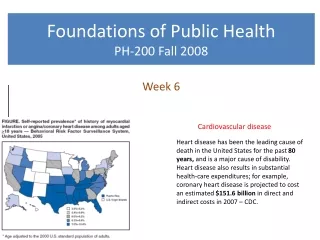
Workforce Populations are Aging: Over 65 to increase from 10% to 16% (2000 and 2040) Labor Pool is Shrinking: 110,000 U.S. PH workers (23%) eligible to retire during next 4 years Under 21 - decrease from 28% to 21% between 2000 and 2040 1980-2000 – Lost 50,000 PH workers in U.S. U.S.Schools of PHmust triple number of graduates by 2020 to replenish the workforce Supply of Health Workers is chronically short in some settings and professions High turnover rates for many professions Chronic mal-distribution of health workers in rural and border areas Minorities are disproportionately represented in the workforce Technological innovations are increasing demand Center for Health Statistics Why do We Need More PH Workers? Reference: 1. “The Texas Public Health Workforce, Texas Health Workforce Planning Partnership, Texas Health Care Policy Council, June 20, 2006, Virginia C. Kennedy, Ph.D., Director, Texas Public Health Training Center. 2. Center for Health Workforce Studies, Public Health Workforce Panel Meeting, July 16, 2001. 3. Report presented to Capitol Hill in February 2008 by the Association of Schools of Public Health. Modified by: Health Professions Resource Center, Center for Health Statistics, October 2008.
PH workers are often underpaid Few career ladders for entry-level PH workers Lack of standardized PH training for some PH professions Competition with non-PH facilities for workers highly trained in analytical and epidemiological skills The largest single group of PH professionals, nurses, tend to be women with families, therefore geographic mobility is often an issue. Center for Health Statistics Why are there Problems with Recruiting and Retaining PH Workers? * Reference: 1. “The Texas Public Health Workforce, Texas Health Workforce Planning Partnership, Texas Health Care Policy Council, June 20, 2006, Virginia C. Kennedy, Ph.D., Director, Texas Public Health Training Center. 2. Center for Health Workforce Studies, Public Health Workforce Panel Meeting, July 16, 2001.
Center for Health Statistics Why is it so Difficult to Count the PH Workforce? • Many are unlicensed non-government generalists who can have more than one job/role • Roles/responsibilities for PH and non-PH workers may overlap • Lack of uniform job titles/roles among state PH workers limits use of data for national comparisons “Public Health Workforce Study, Bureau of Health Professions, HRSA, January 2005. Study accessed on 12/28/06 at http://bhpr.hrsa.gov/healthworkforce/reports/publichealth/default.htm. Prepared by: Texas Department of State Health Services, Center for Health Statistics, Health Professions Resource Center, February 2009.
Center for Health Statistics Recent Efforts at DSHS to Count PH Workers and Assess Vacancy Rates • Surveyed Local Health Departments that contract with DSHS to provide Public Health Services (Participating) • Surveyed Local Health Departments that do not contract with DSHS to provide Public Health Services (Non-Participating) • Collected information on the Public Health Workforce employees at the Health and Human Services Enterprise Agencies Next Steps • Possibly survey Federally Qualified Health Centers/Community Health Centers • Determine and survey other entities that provide Public Health
Center for Health Statistics Survey 1: Local Health Departments - That Contract with DSHS to provide Public Health Services (Participating) • Online survey conducted between Nov. 28, 2007 and Jan. 18, 2008 • 63 Local Health Departments (LHDs) • 29% in Rural Counties (18) • 8% in Border Counties (5) • 100% response rate • Collected supply and vacancy information for 39 PH professions Prepared by: Texas Health Professions Resource Center,Center for Health Statistics, January 2008
Center for Health Statistics Survey 2: Local Health Departments- That DO NOT Contract with DSHS to provide Public Health Services(Non-Participating) • Online survey conducted between Jun. 15, 2008 and Aug. 6, 2008 • 79 Local Health Departments on DSHS list • 37 not truly Local Health Departments (permitting offices, etc) • 9 facilities that did not consider themselves to be public health but employed a total of 12 Sanitarians and 5 Animal Control Officers • Final report focused on remaining 33 Local Health Departments • 12.1% in Rural Counties (4); 6.1% in Border Counties (2) • 95% response rate • Collected supply and vacancy information for 39 PH professions Prepared by: Texas Health Professions Resource Center,Center for Health Statistics, November 2008
Center for Health Statistics Survey 3: Texas Health and Human Services Enterprise • Department of State Health Services • Department of Aging and Disability Services • Texas Health and Human Services Commission • Department of Family and Protective Services • Department of Aging and Rehabilitative Services • Information gathered from HHS Human Resources September 2008 • Collected supply and vacancy information for PH professions
Survey 1: Participating LHDs Center for Health Statistics FTE = Full Time Equivalency (1 FTE=40 hrs/wk, 0.5 FTE= 20 hrs/wk) * 2,419 full-time positions and 181 part-time positions ** 182 vacant positions (full-time and part-time)
Survey 2: Non-Participating LHDs Center for Health Statistics * 258 full-time positions and 30 part-time positions ** 13 vacant positions (full-time and part-time)
Center for Health Statistics Survey 3: Texas Health and Human Services Enterprise Percentage of Currently Staffed FTEs by Agency: 73.7% at Department of State Health Services 23.2% at Department of Aging and Disability Services 2.9% at Health and Human Services Commission 0.1% at Department of Family and Protective Services 0.05% at Department of Aging and Rehabilitative Services * 7,880 full-time positions and 222 part-time positions ** 1,466 full-time vacant positions and 76 part-time positions
With the most Currently Staffed FTEs Center for Health Statistics The top 5 Professions: Mental Health Workers includes Psychiatrists, Social Workers, Psychologists, Psychological Associates, Psychological Assistants, Psychiatric Nursing Assistants, and Psychiatric Nursing Aides *Not included in surveys of LHDs
Center for Health Statistics The top 5 Professions: With the highest number of Vacancies (FTEs) Tie: Local Health Authorities (2) Physicians (2) Tie: Physician Assistants (1) Public Health Technicians (1) Animal Control Officers (1) Tie: Environmental Health Workers/Engineers/ Sanitarians (11) Registered Nurses, APN (11)
Center for Health Statistics The LHDs would like to hire more of if budgets allowed The top 5 Professions: Tie: Public Health Technicians (3) Physicians (3) Thisquestion was not asked of the HHS Enterprise agencies.
Center for Health Statistics Participating (P) Non-Participating (NP) Ten Essential Public Health Functions 1)Monitor health status to identify community health problems - (P)85.7%(NP) 30.3% 2) Diagnose and investigate health problems and health hazards in the community - (P)92.1% (NP) 45.5% 3) Inform, educate, and empower people about health issues - (P)96.8% (NP) 69.7% 4) Mobilize community partnerships to identify and solve health problems - (P)87.3% (NP) 27.3% 5) Develop policies and plans that support individual and community health efforts - (P)85.7% (NP) 39.4% 6) Enforce laws and regulations that protect health and ensure safety - (P)88.9% (NP) 100.0% 7) Link people to needed personal health services and assure the provision of health care when otherwise unavailable - (P)90.5% (NP) 27.3% 8) Assure a competent public health and personal health care workforce - (P)85.7% (NP) 15.2% 9) Evaluate effectiveness, accessibility, and quality of personal and population-based services - (P)73.0% (NP) 18.2% 10) Research for new insights and innovative solutions to health problems - (P)50.8% (NP) 15.2% Only 30 of the 63 Participating LHDs performed all 10 Functions
Center for Health Statistics Comparison of Participating and Non-Participating Local Health Departments Non-Participating LHDs were more focused on Code Enforcement rather than Direct Patient Care.
Center for Health Statistics Summaryof all surveys • 10,777.5 Currently Staffed FTEs • 1,683 Vacancies – 13.5% Vacancy Rate • Largest Professions: • Nursing – 4,844.0 • Registered Nurses – 2,096.0 • Licensed Vocational Nurses – 1,399.5 • Mental Health Workers – 3,408.0 • Psychiatric Nursing Aides, Psychiatric Nursing Assistants – 2,775.0 • Social Workers, licensed and unlicensed - 254.5 • Psychological Associates – 186.0 • Psychiatrists – 120.0 • Psychologists – 59.5 • Psychological Assistants – 10.0 • Other – 3.0 • Other Professions • Environmental Health Workers/Engineers/Sanitarians – 650.5 • Public Health Technicians – 602.5 • Nutritionists and Dietitians – 300.5 • Physicians (not including Psychiatrists) – 170.5 • Dentists – 42.0
Center for Health Statistics Enumerating the Public Health (PH) Workforce Brian King Program Director Health Professions Resource Center Center for Health Statistics Texas Department of State Health Services AUSTIN CONTACT: brian.king@dshs.state.tx.us 512-458-7261 http://www.dshs.state.tx.us/CHS/hprc/