Download
1 / 60
600 likes | 719 Views
Health & Behaviour in the era of Ecological Public Health Tim Lang Centre for Food Policy, City University, London t.lang@city.ac.uk Conference to launch ‘Working Together for a change of life: Salford’s Healthy Weight Strategy 2009-2012’, Innovation Forum, Salford. May 19 2009. Intro.

E N D
Health & Behaviour in the era of Ecological Public Health Tim Lang Centre for Food Policy, City University, London t.lang@city.ac.uk Conference to launch ‘Working Together for a change of life: Salford’s Healthy Weight Strategy 2009-2012’, Innovation Forum, Salford. May 19 2009
Intro • 50 year consumerist model of health and behaviour is running into difficulties • Problems are well-known; responses are patchy • Health challenges coincide with climate change, water stress, biodiversity loss, energy crunch, etc • Human bodies are now in a different & difficult ecological niche: over-consuming and polluting. • This is the era of Ecological Public Health • Big changes are needed and we must speak out
Where does food fit into this picture?4 levels of existence of ecological public health • Material world: • Resources, goods, energy • Biological world: • Physiological interactions, plants • Social world: • Human relationships • Cognitive world: • Mental maps, expectations, understandings
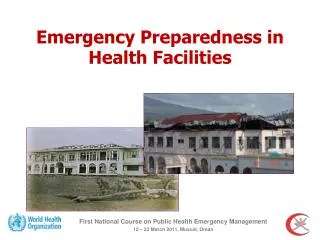
The forgotten past (when people were skinny, the air was foul and tripe was a rare treat)
Cycling through the Salford smog"...A day of smog meant breathing was difficult - the air full of yellow particles that gave a yellow colour and acrid smell. Walking to college required a scarf wrapped tightly around the nose and throat to keep out the burning sensation, arriving with a face half-clean and half-dirty. There was a funny side - streets walked regularly suddenly became strange, you lost all sense of direction, cars trying to follow the kerb at junctions finished on the other side or, worse, trying to follow the centre white line were suddenly facing a car coming the other way. Bus conductors walked in front to guide the driver until it was so slow and dangerous services were withdrawn." [Mr J Cook, Salford]
Salford housing – no so long ago Inside a Pendlebury kitchen, 1956"The kitchen had a shallow stone sink known as a slopstone and just one cold water tap. In the corner was a boiler in which you had to heat water for washing clothes. It was also used for heating water for a bath. We had a large tin bath which we hung outside in the back yard." [Mrs Taylor, Walkden]
Salford has changed from early C20th Food was the major part of family budget Most meals were simple (spuds + bacon fat) Less processed food Physical activity built into everyday life – People forced to walk, forced to work RESULT? – poor physical growth, poor resistance to infection (let’s not be romantic!)
Fat is overproduced yet consumers are told to eat less WHO/FAO (2003) Diet, Nutrition and the Prevention of Chronic Diseases.WHO TR 916 p.18
Energy (oil/fuel) has restructured how we live and consume • Rise of cars • Rise of food freight • Decline of walking, biking to shops • Location of supermarkets • Etc • the built environment factors in lack of rather than use of physical activity to burn kcal
UK Passenger transport by mode (bpkm/%, 1952 – 2005)source: DTI 2006 / Davis, Valsecchi, Fergusson IEEP Unfit for purpose report August 2007 p24
Global rise of motorised transport 1930-2000 Michael P Walsh, Motor Vehicle Pollution Control, Paper to China Fuel Economy Workshop, Hong Kong, December 13, 2004, http://www.walshcarlines.com/china/Applying%20The%20Lessons%20To%20China%20-%20MOVE%20.pdf
EcoPubHlth connects economic change with shifts to packaged/ processed foods: convenience = disempowered consumers 29 Source: Euromonitor, 2003 http://www.euromonitor.com
It connects with the ‘supermarketisation’ of food retailing 30
Food’s direct ecological footprint • Food consumption accounts for 31% of all consumption-related GHG emissions (EC, 2005, EIPRO]) • Agriculture was responsible for 14% of global GHG emissions in 20001 Stern 2007 Annex 7g • 5.2m tonnes of food-related packaging waste and 6.7mt of food waste generated from UK homes each year (WRAP 2007) • UK agriculture uses 742 million m3 of water, and the food and drink industry 155 million m3 used (Defra, Water use in the supply chain, 2007)
NW England ecological footprint 2000: (the land, energy and sea-space) • Totalled 43 mt global hectares (gha) • = 6.2 gha per resident in NW England. • UK food and farming’s footprint is up to six timesthe food growing area of the UK itself • Food = highest single footprint component, estimated at 1.4 gha/per capita • Used 20 mt raw materials to produce 4.2 mt consumed • Used more than 0.5 mt packaging. • But c. 1 mt of food and drink uneaten & to landfill. • Source: Birch et al (2005). Footprint North West. Manchester: Action for Sustainability, University of Manchester, and Stockholm Environment Institute at York
Animals and global warming Global livestock accounts for 18% of GHGs EC EIPRO life cycle environmental impact study, 2005 UK meat & dairy production accounts for 8% of total UK GHG emissions T Garnett FCRN, Univ Surrey 43% of the UK’s methane emissions were from cattle and sheep in 2002 Environment Agency UK (2005) State of the Environment 2005 c.80% of these emissions directly from the animals and 20% from animal waste. EnvAg State of the Environment 2005
Fruit & vegetables: contribution to UK GHG emissionssource: Tara Garnett FCRN • Fruit & veg contribute @ 2.5% of GHGs emitted by UK • Demand for more GHG intensive produce is growing • GHG intensive fruit & veg are: • Air freighted • Unseasonal Mediterranean-style • Pre-prepared, trimmed or chopped • Fragile or highly perishable
Water futures – the tipping point? • 2000-2020 : water availability for humans is expected to drop by one-third • Water scarcity or stress (having less than 1,700 cubic metres of water per person per year) is estimated to affect 40% of humanity by 2050 Consequences: 1. increased food prices and health threats; 2. poor countries likely to be most heavily affected Sources; Stockholm International Water Institute & World Water Council
Water: Kenyan green beans to UKsource: James MacGregor and Bill Vorley IIED/DfID Nov 2006 • 189 million m3 of virtual water each year imported through green beans from Africa • Per stem: 4 litres of virtual water • Water diversion on Mount Kenya reports • Kenya is a ‘water scarce’ country • Considerations: • Access to water is an infrastructural issue • Water scarcity, siting of industry • Embedded labour, oil, air, etc • Marginal water use, system approach: Kenya imports rice
glass beer (250ml) = 75 glass milk (200ml) = 200 glass wine (125ml) = 120 glass apple juice (125ml) =190 cup coffee (125ml) = 140 cup of tea (125ml) = 35 slice of bread (30g) = 40 slice of bread (30g) with cheese (10g) = 90 1 potato (100g) = 25 1 bag of potato crisps (200g) =185 1 egg (40g) = 135 1 hamburger (150g) = 2400 1 cotton T-shirt (medium, 500g) = 4100 1 sheet A4 paper (80g/m20) = 10 1 pair of shoes (bovine leather) = 8000 1 microchip (2g) = 32 Products’ virtual water content (litres) Source: WWF (2006) rich countries, poor water. www.panda.org/freshwater
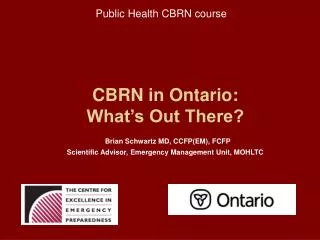
So what can be done? It’s up to individuals to get a grip?Read the labels better?Take advice? Read more books?Yes? No? 38
(And there’s plenty more – and different - advice like this…) 39
A cycle of blame? “The more the state tries to take responsibility for the problem, the less soluble the problem will become, and the more people will indeed feel that they are the “victims” of an affliction, when it is nothing but their own fat fault.” Boris Johnson (MP) Daily Telegraph, 27 May 2004
Or are there other solutions? • Bariatric surgery? • Drugs? • Eat more low fat / functional foods? • Weight camps? • A better idea! Move South (really South)?
Just as in C19th, we must recognise there is no escape • We must tackle things here • We face human existence in our environment • This requires us to change much • It will take time and will • But pressures are growing: • Climate change • Costs are high
Egger & Swinburn model Egger, G. and B. Swinburn, An "ecological" approach to the obesity pandemic.British Medical Journal, 1997. 315(7106): p. 477-480. 47
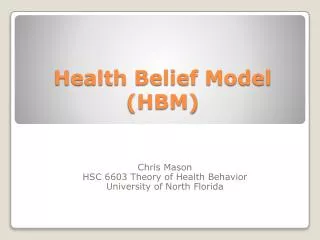
Popkin’s ‘Causal web of influence on the prevalence of obesity’ model Barry M Popkin, Using research on the obesity pandemic as a guide to a unified vision of nutrition, Public Health Nutrition: 8(6A), 724–729, 2005; adapted from Kathleen Mullan Harris, University of North Carolina at Chapel Hill 48
The most comprehensive is UK Foresight ‘systems model’ : The central ‘engine’ UK Foresight 2007 fig 5.1 49 Foresight, Tackling Obesities: Future Choices. 2007, Government Office of Science: London.