Download
1 / 23
230 likes | 361 Views
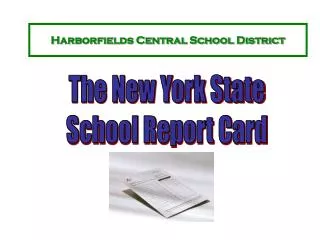
Kentucky’s School Report Card and Spreadsheets. 2012 Workbook. Opening School Page. Profile tab shows basic school/district information/location. Accountability tab shows all five categories of Next Generation Learners with data based on 100 day students.

E N D
Kentucky’s School Report Card and Spreadsheets 2012 Workbook KDE:OAA:DSR:cg:km v1 10/29/2012
Opening School Page Profile tab shows basic school/district information/location. Accountability tab shows all five categories of Next Generation Learners with data based on 100 day students.. Learning Environment tab shows school/district details and demographics. Assessment tab shows data for all students tested on all assessments. Delivery Targets tab has targets for improvement. KDE:OAA:DSR:cg:km v1 10/29/2012
Accountability Tab Accountability Profile Tab click click School Address, Phone and Fax KDE:OAA:DSR:cg:km v1 10/29/2012
Discussion Points • What is our overall score? • What is our percentile rank? Remember this is a percentile not a percentage. • What is our distance from the Overall Score associated with proficient (70th percentile) and AMO for 2013? • What is our Classification? Do we have a Rewards or Assistance Category? • Are we where we want to be? KDE:OAA:DSR:cg:km v1 10/29/2012
Accountability Tab click Next-Generation Learner Tab Weighted Score comes from Achievement, Gap, Growth, College/Career Readiness and Graduation Points multiplied by the weights each has in NxGL. Weighted Score Summary adds the Weighted Scores for each area. Opening page on NxGL shows the five category tabs: Achievement, Gap, Growth, CCR and Graduation Rate. It opens automatically on the Achievement tab. KDE:OAA:DSR:cg:km v1 10/29/2012
Category Questions • Looking at the five categories, generalize what is seen. • Looking at the weighted score, in which category do we score the highest? Why? • Looking at the weighted score, in which category do we score the lowest? Why? (Note: After identifying the category with the lowest weighted score, the next step is to click on the tab identified and drill down with further questions for each category.) KDE:OAA:DSR:cg:km v1 10/29/2012
Accountability - NxGL Tab - Achievement Tab - Grade Level Breakdown After picking a subject area, you can click on the specific grade levels to view further breakdown of the data. Use this to compare performance level by groups of students. Remember: 1). NAPD Calculation comes from the formula: N=0; A=.5; P/D=1(Bonus of .5 is added if there are more distinguished than novice. 2). Points come from the NAPD Calculation multiplied by the equal weight of content areas: Reading, Mathematics, Science, Social Studies are 20% and Writing/Language Mechanics is 20% (Writing 16% and Language Mechanics 4%) KDE:OAA:DSR:cg:km v1 10/29/2012
Achievement Questions Which performance level showed the highest percentage of students for reading, mathematics, etc.? Which performance level showed the lowest percentage of students for reading, mathematics, etc.? What can we do to increase P/D while reducing N/A? (such as instructional strategies or increasing teacher training and professional development) Do any particular subgroups stand out as needing improvement more than others? (sample shows highest percent novice are students with IEPs) KDE:OAA:DSR:cg:km v1 10/29/2012
Assessment Tab Assessment tab offers data for tested students on state-required and other tests (i.e., Advanced Placement and NAEP). KDE:OAA:DSR:cg:km v1 10/29/2012
Assessment – State Required Tests – K-PREP – Middle School - 07 Under the Assessment tab you will pick either State Required Tests or Other Tests. With the test of interest , select the disaggregated data you want to review. Clicking on the grade level breaks it down into groups. (Any spot with a triangle that is underlined is a link to disaggregated data. KDE:OAA:DSR:cg:km v1 10/29/2012
Assessment – State Required Tests – K-PREP – Middle School - 07 Use data found here to compare particular groups, to find high/low performing groups or to help identify where your school/district might want to add more focused attention. For individual student information, refer to the KDE-provided spreadsheets. For reporting category information from Pearson assessments, see School Summary Reports in PearsonAccess. KDE:OAA:DSR:cg:km v1 10/29/2012
Assessment – State Required Tests – K-PREP End-of-Course End-of-Course data is broken down by subject, all students and by groups of students (M/F, ethnicity, free/reduced, etc.). KDE:OAA:DSR:cg:km v1 10/29/2012
Assessment – State Required Tests – ACT/PLAN/EXPLORE Only shows information for grades at your school. Shown are the average scores and percent meeting each set of benchmarks. Then, use spreadsheets to find individual student information. KDE:OAA:DSR:cg:km v1 10/29/2012
Assessment – Other Tests – Advanced Placement or NAEP Advanced Placement data is loaded as it becomes available from the vendor. NAEP data is general state level information, never school or student level. KDE:OAA:DSR:cg:km v1 10/29/2012
Accountability – NxGL – GAP – Subject Breakdown Remember: 1). NAPD Calculation for GAP comes from the percent of Proficient/Distinguished only in the Non-duplicated Gap Group. 2). Points come from the NAPD Calculation multiplied by the equal weight of content areas: Reading, Mathematics, Science, Social Studies being 20% and Writing/Language Mechanics 20% (Writing 16% and Language Mechanics 4%). KDE:OAA:DSR:cg:km v1 10/29/2012
GAP Questions In what content area are GAP kids most challenged? In what content area are GAP kids most successful? In what content area do we have the largest percent of P/D performance? How are we identifying our GAP kids? By subject area, drill down to see areas for improvement and how we compare in the district/state. KDE:OAA:DSR:cg:km v1 10/29/2012
Accountability – NxGL – GROWTH Reminder: Growth Points Total comes from average of Reading Percent and Mathematics Percent of students making typical annual growth (at or above the 40th Student Growth Percentile). KDE:OAA:DSR:cg:km v1 10/29/2012
Growth Questions • Typical Growth is at the 40th percentile, how many of our kids are not there in reading? Mathematics? • Which subject has the highest Growth? • What do Growth percentiles look like for students who scored Distinguished or Novice? • What can we do to improve Growth for students below the 40th percentile? (Refer to spreadsheet and student listings, to identify specific students.) • How does our school/district compare to Growth in Kentucky? KDE:OAA:DSR:cg:km v1 10/29/2012
Accountability – NxGL – CCR – Student Breakdown Remember: Percentage of graduates College and/or Career Ready shows non-duplicated totals for a school. Bonus is added, if applicable. KDE:OAA:DSR:cg:km v1 10/29/2012
CCR Questions What are the criteria for the 3 categories – college, career or both? How many students were determined college ready? Career ready? Both? How do we compare to other schools in the district/state? What is the college/career readiness percentage for specific student groups within our school? What are the implications for instruction and curriculum? Knowing what it takes to be CCR, look at ACT performance of current seniors. What can we do to get more students ready? Are we using COMPASS/KYOTE? KDE:OAA:DSR:cg:km v1 10/29/2012
Accountability – NxGL – GRADUATION RATE – AFGR Information KDE:OAA:DSR:cg:km v1 10/29/2012
Graduation Rate Questions How does our Graduation Rate compare to other schools in our district? In the state? What type of interventions can be provided to increase student completion and persistence to graduation? KDE:OAA:DSR:cg:km v1 10/29/2012