Download
1 / 9
90 likes | 92 Views
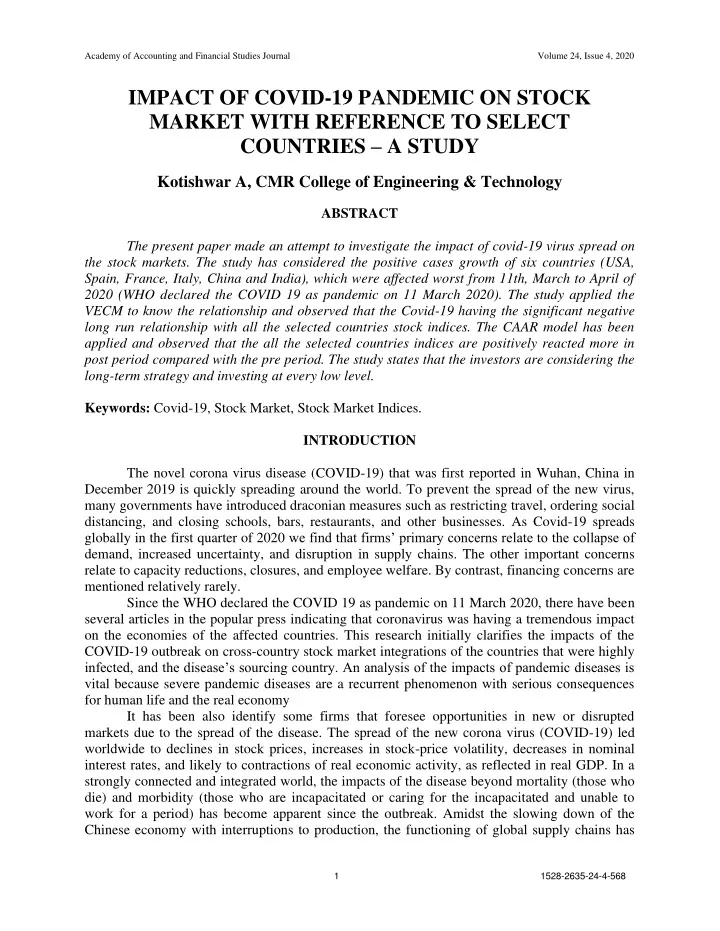
The present paper made an attempt to investigate the impact of covid-19 virus spread on the stock markets. The study has considered the positive cases growth of six countries (USA, Spain, France, Italy, China and India), which were affected worst from 11th, March to April of 2020 (WHO declared the COVID 19 as pandemic on 11 March 2020). The study applied the VECM to know the relationship and observed that the Covid-19 having the significant negative long run relationship with all the selected countries stock indices. The CAAR model has been applied and observed that the all the selected countries indices are positively reacted more in post period compared with the pre period. The study states that the investors are considering the long-term strategy and investing at every low level.

E N D
Academy of Accounting and Financial Studies Journal Volume 24, Issue 4, 2020 IMPACT OF COVID-19 PANDEMIC ON STOCK MARKET WITH REFERENCE TO SELECT COUNTRIES – A STUDY Kotishwar A, CMR College of Engineering & Technology ABSTRACT The present paper made an attempt to investigate the impact of covid-19 virus spread on the stock markets. The study has considered the positive cases growth of six countries (USA, Spain, France, Italy, China and India), which were affected worst from 11th, March to April of 2020 (WHO declared the COVID 19 as pandemic on 11 March 2020). The study applied the VECM to know the relationship and observed that the Covid-19 having the significant negative long run relationship with all the selected countries stock indices. The CAAR model has been applied and observed that the all the selected countries indices are positively reacted more in post period compared with the pre period. The study states that the investors are considering the long-term strategy and investing at every low level. Keywords: Covid-19, Stock Market, Stock Market Indices. INTRODUCTION The novel corona virus disease (COVID-19) that was first reported in Wuhan, China in December 2019 is quickly spreading around the world. To prevent the spread of the new virus, many governments have introduced draconian measures such as restricting travel, ordering social distancing, and closing schools, bars, restaurants, and other businesses. As Covid-19 spreads globally in the first quarter of 2020 we find that firms’ primary concerns relate to the collapse of demand, increased uncertainty, and disruption in supply chains. The other important concerns relate to capacity reductions, closures, and employee welfare. By contrast, financing concerns are mentioned relatively rarely. Since the WHO declared the COVID 19 as pandemic on 11 March 2020, there have been several articles in the popular press indicating that coronavirus was having a tremendous impact on the economies of the affected countries. This research initially clarifies the impacts of the COVID-19 outbreak on cross-country stock market integrations of the countries that were highly infected, and the disease’s sourcing country. An analysis of the impacts of pandemic diseases is vital because severe pandemic diseases are a recurrent phenomenon with serious consequences for human life and the real economy It has been also identify some firms that foresee opportunities in new or disrupted markets due to the spread of the disease. The spread of the new corona virus (COVID-19) led worldwide to declines in stock prices, increases in stock-price volatility, decreases in nominal interest rates, and likely to contractions of real economic activity, as reflected in real GDP. In a strongly connected and integrated world, the impacts of the disease beyond mortality (those who die) and morbidity (those who are incapacitated or caring for the incapacitated and unable to work for a period) has become apparent since the outbreak. Amidst the slowing down of the Chinese economy with interruptions to production, the functioning of global supply chains has 1 1528-2635-24-4-568
Academy of Accounting and Financial Studies Journal Volume 24, Issue 4, 2020 been disrupted. Companies across the world, irrespective of size, dependent upon inputs from China have started experiencing contractions in production. Transport being limited and even restricted among countries has further slowed down global economic activities. Most importantly, some panic among consumers and firms has distorted usual consumption patterns and created market anomalies. Global financial markets have also been responsive to the changes and global stock indices have plunged. Amidst the global turbulence, in an initial assessment, the International Monetary Fund expects China to slow down by 0.4 percentage points compared to its initial growth target to 5.6 percent, also slowing down global growth by 0.1 percentage points. This is likely to be revised in coming weeks 4. Therefore, this study, explores the impact of unexpected high severity event (COVID 19.) on financial market integration. REVIEW OF LITERATURE The effect of the corona virus pandemic on an economy is potentially important, particularly as its origin source was China, which has been a key centre of foreign investment in Asia, and in 2019 the disease began to have a domino effect throughout regional economies. To several countries brought worldwide attention to the issue that it was a deadly new disease and was spreading quickly (Siu & Wong, 2004). Globalisation increases the likelihood that an infectious disease appearing in one country will spread rapidly to another, and outbreaks of more serious diseases could cause catastrophic impacts on the global economy (Smith, 2006). The impact of the corona virus pandemic on human society around the world is striking, not just because the disease spread quickly across countries through global travel, but also because any economic shock to one country quickly spread to others due to financial integration and globalisation (Lee & McKibbin, 2004a; Dewatripont, 2020). Contrary to logic, Siu & Wong (2004) find no anecdotal evidence to indicate that the corona virus pandemic had negative effects on either domestic or global investment. Most previous studies on the economic effects of epidemics focus on disease-associated medical costs or economic effects as a result of disease-related morbidity and mortality. For example, Chou et al. (2003) and Siu & Wong (2004) provide findings of the economic effects of the S.A.R.S. epidemic on individual countries, such as China, Hong Kong, and Taiwan. The unfortunate situation created by the corona virus gives us a unique opportunity to gauge the impact of an unexpected and dreaded disease on the economies of affected nations The corona virus pandemic also involved a clear change in investors’ risk level Economists have long observed that societal responses to health risks tend to be extreme and inconsistent (Viscusi & Evans, 1990). It is important to address that the individual’s responses to the corona virus outbreak were not only observed in the healthcare market but also in the financial market. Several existing works explore the relationships between corona virus outbreak and stock returns. Chen et al. (2007) confirm that the tourism industry experienced the most serious damage in terms of stock price decline in the Stock Exchange during the corona virus outbreak period. In addition, Ali et al. (2010) show that the investors over-responded to the corona virus outbreak in terms of dramatic stock price decline in the stock market. The stock prices are more volatile in the trading days during some crisis periods than those during non-crisis periods. The evidence generated by these empirical studies confirms that the investors would respond to the corona virus outbreak through the adjustment of stock prices in several countries’ stock markets. Baker et al. (2020) from the study no previous infectious disease outbreak, including the Spanish Flu, has impacted the stock market as forcefully as the COVID-19 pandemic. In fact, previous 2 1528-2635-24-4-568
Academy of Accounting and Financial Studies Journal Volume 24, Issue 4, 2020 pandemics left only mild traces on the U.S. stock market. They used text-based methods to develop these points with respect to large daily stock market moves back to 1900 and with respect to overall stock market volatility back to 1985. They also evaluated potential explanations for the unprecedented stock market reaction to the COVID-19 pandemic. The evidence we amass suggests that government restrictions on commercial activity and voluntary social distancing, operating with powerful effects in a service-oriented economy, are the main reasons the U.S. stock market reacted so much more forcefully to COVID-19 than to previous pandemics in 1918-19, 1957-58 and 1968 (Barro et al. 2020). Objectives of the Study 1.To examine the relationship of Covid-19 pandemic with the select countries stock market indices. 2.To study the impact of Covid – 19 pandemic on select countries Stock market indices returns. Hypotheses of the Study H0: There is no relationship of Covid-19 pandemic with the select countries stock market indices. H0: There is no impact of Covid – 19 pandemic on the select countries stock market returns. Scope of the Study To examine the impact of corona virus, the following stock indices were chosen: the Nifty 50 Composite Index to represent India, the China A50 Composite Index to represent the People's Republic of China, the Dow Jones industrial average to represent united states, the IBSE MIB index to represent Italy, the IBEX-35 Index to represent Spain, and the CAC-40 Index to represent the France (Meninno & Wolff, 2020). The above indices are arguably the most representative indices of these countries’ stock markets in the world press. Research Methodology The present study has considered the time series data of selected six countries stock market indices. The study applied the following statistical methods for the examination of framed objectives. VECM: The present study measured the relationship (long or short run) between the Covid-19 pandemic (Independent variable) and select countries stock market indices (Dependent Variables) with the help of vector error correction model. CAAR Model: The study applied the Cumulative Average Abnormal Returns Model to know the effect of Covid-19 pandemic on the selected countries stock market indices returns. The CAAR will reveal the effect of onetime events impact on the stock market returns on short term. Data Analysis The relationship of Covid-19 with the select countries stock market indices. The study applied vector Error correction model to know the relationship of Carona positive cases with the select countries indices. The study applied the lag order selection to know 3 1528-2635-24-4-568
Academy of Accounting and Financial Studies Journal Volume 24, Issue 4, 2020 the optimum model to run the VECM. Table 1 LAG ORDER SELECTION VAR Lag Order Selection Criteria Endogenous variables: DOWJONES CAC40 FTSE IBEX NIFTY SHANGHAI COVIDCASES Exogenous variables: C Sample: 1 45 Included observations: 42 Lag LogL LR FPE 0 -2258.067 NA 1.64e+38 1 -2063.707 314.6796 1.67e+35 2 -1986.145 99.72138 5.24e+34 3 -1891.611 90.03307* 1.07e+34* * indicates lag order selected by the criterion LR: sequential modified LR test statistic (each test at 5% level) FPE: Final prediction error AIC: Akaike information criterion SC: Schwarz information criterion HQ: Hannan-Quinn information criterion Source: compiled data The Table 1 provides the criteria for selecting the lag order model for the Covid case relationship to select the return performance of the stock indices. The statistics of the LR test and the Final Prediction Error estimated the lag 3 model to be most appropriate for model assessment. Criteria such as the Akaike Information Criterion and the Hannan-Quinn Information Criterion are in lag 3, while the Schwarz Information Criterion is considered to be in lag 1. As a result, most of the criterion was fit at lag 3, which concluded that lag 3 was optimal for estimating the model Ochrane, (2020). Vector Error Correction Model estimated the relationship between the pandemic effects of Covid on selected stock indices. Here, the country stock indices considered to be dependent variables and the cases of covid have independent variables. The Table 2 shows that the selected stock indices are found to be weak in relation to the covid pandemic effect and also shows that, except for the nifty, the remaining stock indices have a positive relationship to the covid pandemic effect. Further, the r-square of the model for each variable is observed to be above the recommended level (> 0.60). System Equation D(COVIDCASES) = C(139)*( DOWJONES(-1) - 8.66127688939*CAC40(-1) + 2.62892139183 *FTSE(-1) - 3.61989344828*IBEX(-1) - 1.74214273043*NIFTY(-1) - 0.545727249384* SHANGHAI(-1) - 0.124723712664*COVIDCASES(-1) + 22558.6151097 ) + C(140)* D(DOWJONES(-1)) + C(141)*D(CAC40(-1)) + C(142)*D(FTSE(-1)) + C(143)*D(IBEX(-1)) + C(144)*D(NIFTY(-1)) + C(145)*D(SHANGHAI(-1)) + C(146)*D(COVIDCASES(-1)) + C(147)*D(DOWJONES(-2)) + C(148)*D(CAC40(-2)) + C(149)*D(FTSE(-2)) + C(150)* D(IBEX(-2)) + C(151)*D(NIFTY(-2)) + D(COVIDCASES(-2)) + C(154)*D(DOWJONES(-3)) + C(155)*D(CAC40(-3)) + C(156)* D(FTSE(-3)) + C(157)*D(IBEX(-3)) + C(158)*D(NIFTY(-3)) + C(159)*D(SHANGHAI(-3)) + AIC SC HQ 107.8604 100.9384 99.57836 97.41004* 108.1500 103.2553* 103.9225 103.7815 107.9665 101.7876 101.1707 99.74543* C(152)*D(SHANGHAI(-2)) + C(153)* 4 1528-2635-24-4-568
Academy of Accounting and Financial Studies Journal Volume 24, Issue 4, 2020 C(160)*D(COVIDCASES(-3)) + C(161) Table 2 VECTOR ERROR CORRECTION MODEL Vector Error Correction Estimates Sample (adjusted): 5 45 Included observations: 41 after adjustments Standard errors in ( ) & t-statistics in [ ] CointegratingEq: DOWJONES(-1) CAC40(-1) FTSE(-1) IBEX(-1) NIFTY(-1) SHANGHAI(-1) COVIDCASES(-1) C Error Correction: CointEq1 D(DOWJONES(-1)) D(DOWJONES(-2)) D(DOWJONES(-3)) D(CAC40(-1)) D(CAC40(-2)) D(CAC40(-3)) CointEq1 1.000000 -8.661277 (1.02811) [-8.42445] 2.628921 (0.20202) [ 13.0133] -3.619893 (0.93102) [-3.88808] -1.742143 (0.15097) [-11.5394] -0.545727 (0.16102) [-3.38928] -0.124724 (0.01162) [-10.7372] 22558.62 D(DOWJONES) D(CAC40) D(FTSE) D(IBEX) D(NIFTY) D(SHANGHAI) D(COVIDCASES) -0.835738 0.012018 -0.122176 0.016530 0.107303 (0.51618) (0.09652) (0.48880) (0.17390) (0.15191) [-1.61909] [ 0.12451] [-0.24995] [ 0.09505] [ 0.70636] 0.473828 0.039471 0.171795 0.099033 -0.003332 (0.53452) (0.09995) (0.50617) (0.18008) (0.15731) [ 0.88646] [ 0.39490] [ 0.33940] [ 0.54993] [-0.02118] 0.323377 -0.046843 -0.176508 -0.015171 0.163577 (0.46336) (0.08665) (0.43878) (0.15611) (0.13636) [ 0.69790] [-0.54063] [-0.40227] [-0.09718] [ 1.19956] -0.010125 -0.032949 0.091983 0.040849 0.256126 (0.36306) (0.06789) (0.34381) (0.12232) (0.10685) [-0.02789] [-0.48532] [ 0.26754] [ 0.33395] [ 2.39710] -1.409647 0.333665 -0.144494 -0.025683 0.322408 (4.88871) (0.91416) (4.62944) (1.64703) (1.43873) [-0.28835] [ 0.36499] [-0.03121] [-0.01559] [ 0.22409] -2.284532 -0.091465 1.281583 -0.387531 0.214425 (4.53209) (0.84748) (4.29173) (1.52688) (1.33377) [-0.50408] [-0.10793] [ 0.29862] [-0.25381] [ 0.16077] -7.551659 -0.889031 -4.085555 -1.580162 -0.255819 -0.007761 (0.11611) [-0.06684] -0.036009 (0.12024) [-0.29948] -0.075822 (0.10423) [-0.72745] -0.054651 (0.08167) [-0.66917] 0.961427 (1.09969) [ 0.87427] 0.030575 (1.01947) [ 0.02999] -1.904266 4.439066 (1.36558) [ 3.25068] -1.370367 (1.41410) [-0.96907] -0.842573 (1.22584) [-0.68734] -0.234307 (0.96051) [-0.24394] -13.93040 (12.9334) [-1.07709] 35.31317 (11.9899) [ 2.94524] 3.149188 5 1528-2635-24-4-568
Academy of Accounting and Financial Studies Journal Volume 24, Issue 4, 2020 (4.91471) [-1.53654] 1.917708 (1.43752) [ 1.33404] 1.133965 (1.03073) [ 1.10015] 2.423970 (1.02848) [ 2.35684] -6.827912 (3.57118) [-1.91195] 0.382206 (2.54705) [ 0.15006] -1.542087 (2.79023) [-0.55267] 0.170085 (0.80324) [ 0.21175] -0.028797 (0.70086) [-0.04109] -1.654871 (0.75794) [-2.18339] 3.180654 (0.89212) [ 3.56526] -0.284637 (1.07924) [-0.26374] 0.550572 (1.10374) [ 0.49883] 0.012184 (0.08368) [ 0.14561] 0.027701 (0.06075) (0.91903) (4.65407) (1.65579) (1.44638) [-0.96736] [-0.87785] [-0.95432] [-0.17687] 0.058605 0.913936 0.316506 0.106843 (0.26881) (1.36128) (0.48431) (0.42306) [ 0.21802] [ 0.67138] [ 0.65352] [ 0.25255] -0.047689 -0.377583 0.042488 -0.074812 (0.19274) (0.97607) (0.34726) (0.30334) [-0.24743] [-0.38684] [ 0.12235] [-0.24663] 0.115696 0.721266 0.347543 0.443606 (0.19232) (0.97394) (0.34650) (0.30268) [ 0.60158] [ 0.74057] [ 1.00301] [ 1.46560] -0.584315 -3.251923 -1.324554 -0.905927 (0.66779) (3.38179) (1.20315) (1.05098) [-0.87499] [-0.96160] [-1.10091] [-0.86198] 0.529895 2.271435 0.689906 -0.068653 (0.47629) (2.41197) (0.85812) (0.74959) [ 1.11256] [ 0.94173] [ 0.80398] [-0.09159] 0.248419 0.426738 -0.291156 -1.355692 (0.52176) (2.64225) (0.94004) (0.82115) [ 0.47612] [ 0.16151] [-0.30973] [-1.65096] 0.049671 0.155274 0.172891 -0.089155 (0.15020) (0.76064) (0.27061) (0.23639) [ 0.33070] [ 0.20414] [ 0.63888] [-0.37715] 0.126850 0.376319 0.033665 -0.039134 (0.13106) (0.66369) (0.23612) (0.20626) [ 0.96790] [ 0.56701] [ 0.14258] [-0.18973] -0.147960 -0.458309 -0.151931 0.081482 (0.14173) (0.71774) (0.25535) (0.22306) [-1.04396] [-0.63854] [-0.59499] [ 0.36530] 0.452921 1.661040 0.726105 0.281377 (0.16682) (0.84481) (0.30056) (0.26255) [ 2.71498] [ 1.96617] [ 2.41583] [ 1.07171] -0.009927 -0.048449 -0.035028 -0.096588 (0.20181) (1.02200) (0.36360) (0.31762) [-0.04919] [-0.04741] [-0.09634] [-0.30410] -0.092652 -1.434074 -0.234091 0.019159 (0.20639) (1.04520) (0.37186) (0.32483) [-0.44891] [-1.37205] [-0.62952] [ 0.05898] 0.009164 0.030686 0.014339 -0.035925 (0.01565) (0.07924) (0.02819) (0.02463) [ 0.58566] [ 0.38726] [ 0.50865] [-1.45886] 0.005724 0.035506 0.009961 -0.019057 (0.01136) (0.05753) (0.02047) (0.01788) (1.10554) [-1.72248] 0.155597 (0.32336) [ 0.48119] -0.072824 (0.23186) [-0.31409] 0.589657 (0.23135) [ 2.54875] -0.816601 (0.80332) [-1.01654] 0.424694 (0.57294) [ 0.74125] -0.481843 (0.62765) [-0.76770] 0.359912 (0.18068) [ 1.99195] 0.220202 (0.15765) [ 1.39674] -0.236134 (0.17049) [-1.38501] 0.164357 (0.20068) [ 0.81901] -0.206374 (0.24277) [-0.85009] 0.536236 (0.24828) [ 2.15981] 0.000303 (0.01882) [ 0.01607] 0.007002 (0.01367) (13.0022) [ 0.24220] -0.822518 (3.80304) [-0.21628] -3.641402 (2.72687) [-1.33538] -6.254275 (2.72092) [-2.29859] 1.016237 (9.44778) [ 0.10756] -8.532785 (6.73839) [-1.26629] 5.849330 (7.38173) [ 0.79241] 3.736683 (2.12501) [ 1.75843] 0.671202 (1.85417) [ 0.36200] 0.569327 (2.00517) [ 0.28393] 3.753370 (2.36017) [ 1.59030] 6.383521 (2.85519) [ 2.23576] -2.169943 (2.92001) [-0.74313] 0.324722 (0.22137) [ 1.46687] -0.201851 (0.16072) D(FTSE(-1)) D(FTSE(-2)) D(FTSE(-3)) D(IBEX(-1)) D(IBEX(-2)) D(IBEX(-3)) D(NIFTY(-1)) D(NIFTY(-2)) D(NIFTY(-3)) D(SHANGHAI(-1)) D(SHANGHAI(-2)) D(SHANGHAI(-3)) D(COVIDCASES(-1)) D(COVIDCASES(-2)) 6 1528-2635-24-4-568
Academy of Accounting and Financial Studies Journal Volume 24, Issue 4, 2020 [ 0.45598] 0.096505 (0.07848) [ 1.22964] -280.1487 (209.569) [-1.33679] 0.746912 0.437582 12730810 840.9918 2.414614 -317.4187 16.60579 17.56706 -135.5359 1121.404 [ 0.50390] [ 0.61721] [ 0.48667] [-1.06595] 0.016040 0.052314 0.008654 -0.020340 (0.01468) (0.07432) (0.02644) (0.02310) [ 1.09296] [ 0.70390] [ 0.32729] [-0.88062] -60.40879 -209.1449 -92.63766 -2.134611 (39.1883) (198.455) (70.6049) (61.6753) [-1.54150] [-1.05387] [-1.31206] [-0.03461] 0.611522 0.625000 0.639405 0.790436 0.136715 0.655556 0.623545 0.634302 445160.1 11416283 1445014. 1102616. 157.2613 796.3906 283.3347 247.5004 1.287938 0.904306 0.958176 3.086027 -248.6751 -315.1846 -272.8127 -267.2688 13.25245 16.49681 14.42989 14.15945 14.21372 17.45808 15.39116 15.12072 -38.97268 -176.5771 -69.99512 -73.80610 169.2563 775.1496 280.0570 362.6802 8.80E+29 -1820.714 97.01042 104.0319 168 [ 0.51241] 0.014216 (0.01765) [ 0.80524] -14.14104 (47.1413) [-0.29997] 0.680078 0.789063 644177.8 189.1763 1.739263 -256.2507 13.62199 14.58326 -16.60976 224.3629 [-1.25594] 0.129990 (0.20763) [ 0.62607] -62.16606 (554.427) [-0.11213] 0.871881 0.715292 89102938 2224.896 5.567940 -357.3070 18.55156 19.51283 1078.927 4169.747 D(COVIDCASES(-3)) C R-squared Adj. R-squared Sum sq. resids S.E. equation F-statistic Log likelihood Akaike AIC Schwarz SC Mean dependent S.D. dependent Determinant resid covariance (dof adj.) 2.80E+32 Determinant resid covariance Log likelihood Akaike information criterion Schwarz criterion Number of coefficients Source: compiled data Wald Test Null hypothesis: There is no long-term relationship between the Covid-19 pandemic effect and the selected stock indices Alternative Hypothesis: There is long-term relationship between the Covid-19 pandemic effect and the selected stock indices. Table 3 WALD TEST Dow Jones (America) CAC40 (France) FTSE (UK) Italy (MIB) IBEX (Spain) Nifty (India) Shanghai (China) ` The Wald test (Table 3) shows that the Dow Jones chi-square is 12.12511 which is above the critical value (7,815), which implies that the null hypothesis is rejected. Similarly, France and UK stock indexes are shown to be below the critical value, i.e., the rejection of the null hypothesis. Spain, India and China are found to have a chi-square value lower than the critical value. From the above table, it is clear that stock indices have a long-term relationship with the pandemic effect of Covid 19. Confirming that, during the COVID 19 attack, markets are in panic Wald Test: System: %system Test Statistic Chi-square Chi-square Chi-square Chi-square Chi-square Chi-square Chi-square df Probability 0.0164 0.0036 Value 12.12511 15.60659 29.38575 21.93621 23.85539 14.98149 15.12604 4 4 4 4 4 4 4 0 0.0026 0.0001 0.0047 0.0044 7 1528-2635-24-4-568
Academy of Accounting and Financial Studies Journal Volume 24, Issue 4, 2020 as confusion prevails. This has sent markets around the world crashing to depths that have not been seen since the 2008 Global Financial Crisis following a strong correlation with trends and indexes of the global economy slump. The study examined the six countries stock market indices to know the Covid-19 pandemic impact. The study has considered the historical daily indices data for the period of 45 days in pre and post Covid-19 pandemic effect. The following is the result reflects the performance of the markets of six countries Table 4. Table 4 STUDY THE IMPACT OF COVID 19 PANDEMIC ON SELECT COUNTRIES STOCK MARKET INDICES Pre Post Cumulative Returns 28 17 31 14 30 15 28 17 31 14 31 14 Cumulative Returns 22 23 25 20 33 12 24 21 25 20 22 23 Returns 22 23 25 20 23 22 27 18 23 22 23 22 Returns 18 27 21 24 25 20 25 20 21 24 26 19 Index Positive/Negative Positive Days Negative days Positive Days Negative days Positive Days Negative days Positive Days Negative days Positive Days Negative days Positive Days Negative days India-Nifty USA- Dow Jones China- Shangai Italy - MIB Spain- Ibex France- CAC-40 Source: compiled data The study examines the impact of Corona on the stock market returns in pre and post period. The study has classified in pre and post period for 45 days. The study examined for the six countries-based equity market indices, which were recorded with higher positive corona patients. It is clearly evident with the result that positive CAAR days are observed to be more than the negative CAAR days, which indicates that the Carona positive cases impact on the stock market is not effective, as mostly investors are discounting the Carona and investing for the long run in all the countries. Findings of the Study 1.The study observed with the VECM that Covid-19 pandemic is having the significant long run relationship with all the selected countries indices. 2.The study observed that the selected countries are having the negative relationship with the covid-19 pandemic. 3.The study applied the CAAR method and result reveals that the post period CAAR values are observed to be having higher positive than the negative days, which indicates that compared to pre period Covid-19 pandemic effect is positive on the growth of selected indices, as the investors are investing at every low level of the markets. 4.The study found that equity market investors are taking the advantage of falling and at every low of benchmark is a buying opportunity. 8 1528-2635-24-4-568
Academy of Accounting and Financial Studies Journal Volume 24, Issue 4, 2020 CONCLUSION The present study has been focused on the impact of Covid-19 pandemic on the select global equity markets. The study has considered the positive cases growth of six countries (USA, Spain, France, Italy, China and India), which were effected worst from 11th, March to April of 2020 (WHO declared the COVID 19 as pandemic on 11 March 2020). The study mainly focused on the positive cases relationship with the selected countries stock indices for the short-term period. The study applied the statistical method of vector error correction model and found that all the selected countries are having the significant long run relationship with the stock indices. The CAAR model has been applied to know the effect on the equity markets with the covid-19 pandemic. The study observed that the stock markets across the global have positively reacted in the pandemic. The study states that the investors are considering the long-term strategy and investing at every low level. Hence, there is a need to do research in this area by considering the impact of covid -19 effected deaths on the selected countries market returns. REFERENCES Ali, N., Nassir, A., Hassan, T., & Abidin, S. (2010). Short run stock overreaction: Evidence from Bursa Malaysia. International Journal of Economics and Management, 4. 319-333. Barro, R.J., Ursua, J.F., & Weng, J. (2020). The Carono virus and the great influenza pandemic: Lessons from the ‘Spanish Flu’ for the Corona virus’s Potential Effects on Mortality and Economic Activity. CESifo Working Paper No. 8166. Chen, M.H., Jang, S., & Kim, W. (2007). The impact of the SARS outbreak on Taiwanese hotel stock performance: An event-study approach. International Journal of Hospitality Management. 200-212. Chou, J., Kuo, N.F., & Peng, S.L. (2004). Potential impacts of the SARS outbreak on Taiwan's economy. Asian Economic Papers, 3, 84-99. Baker, C.R., Bloom, N., Davis, S.J., Kost, K., Sammon, M., & Viratyosin, T. (2020). The UnprecedentedStock Market Reaction to COVID-19 Retrieved from https://bfi.uchicago.edu/wp-content/uploads/BFI_White- Paper_Davis_3.2020.pdf Dewatripont, M., Goldman, M., Muraille, E., & Platteau, J.P. (2020). Rapidly identifying workers who are immune to covid-19 and virus-free is a priority for restarting the economy. Retrieved from VoxEU.org Lee, J.W., & McKibbin W. (2004). Globalization and disease: The case of SARS. Asian Economic Papers. MIT Press; Cambridge MA: 2004. Meninno, R., & Wolff, G. (2020). As Coronavirus Spreads, Can the EU Afford to Close Its Borders? in R. Baldwin and B. Weder di Mauro (eds), Economics in the Time of COVID-19, a VoxEU.org eBook, CEPR Press Ochrane, J.H. (2020). Flatten the Coronavirus Curve at a Lower Costs. Wall Street. Siu, A., & Wong, R. (2004). Economic impact of SARS: the case of Hong Kong. Asian Economic Papers, 3, 62-83. Smith R.D. (2006). Responding to global infectious disease outbreaks: lessons from SARS on the role of risk perception, communication and management. Social science & medicine (1982), 63(12), 3113–3123. Viscusi, W.K., & Evans, W. (1990). Utility functions that depend on health status: Estimates and economic implications. American Economic Review, 80(3), 353-74. 9 1528-2635-24-4-568