Download
1 / 22
240 likes | 490 Views
The major histocompatibility complex (MHC). Man: HLA Mouse: H2 Dog: DLA etc. T-cell. TCR. MHC. Antibody. TCR has MHC restriction. Antibodies protect against extracellular microbes. T-cells protect against intracellular microbes. The TCR recognizes peptides bound to MHC molecules.

E N D
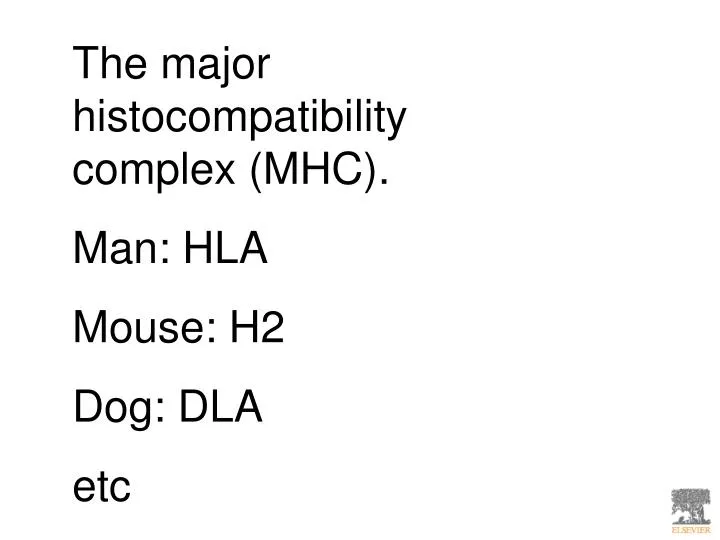
The major histocompatibility complex (MHC). Man: HLA Mouse: H2 Dog: DLA etc
T-cell TCR MHC Antibody TCR has MHC restriction
Antibodies protect against extracellular microbes. T-cells protect against intracellular microbes.
The TCR recognizes peptides bound to MHC molecules. Figure 5-1 T cell recognition of a peptide-MHC complex. This schematic illustration shows an MHC molecule binding and displaying a peptide and a T cell receptor recognizing two polymorphic residues of the MHC molecule and one residue of the peptide. Details of the interactions of peptides, MHC molecules, and T cell receptors are described in Chapters 5, 6, and 7. Downloaded from: StudentConsult (on 4 January 2008 02:06 PM) © 2005 Elsevier
Figure 5-3 Schematic maps of human and mouse MHC loci. The basic organization of the genes in the MHC locus is similar in humans and mice. Sizes of genes and intervening DNA segments are not shown to scale. Class II loci are shown as single blocks but each locus consists of several genes. Class III MHC locus refers to genes that encode molecules other than peptide-display molecules; this term is not used commonly. A more detailed map of the human MHC is in Figure 5-9. Downloaded from: StudentConsult (on 4 January 2008 02:06 PM) © 2005 Elsevier
Map of human MHC Figure 5-9 Map of the human MHC. This map is simplified to exclude many genes that are of unknown function. HLA-E, HLA-F, and HLA-G, and the MIC genes are class I-like molecules, many of whose products are recognized by NK cells; C4, C2, and factor B genes encode complement proteins; tapasin, DM, DO, TAP, and proteasome encode proteins involved in antigen processing; LTA, B, and TNF encode cytokines. Many pseudogenes and genes whose roles in immune responses are not established are located in the HLA complex but are not shown. Downloaded from: StudentConsult (on 4 January 2008 02:06 PM) © 2005 Elsevier
MHC genes control graft rejection and immune responses Figure 5-2 MHC genes control graft rejection and immune responses. The two strains of mice shown are identical except for their MHC alleles (referred to as a and b). These strains reject skin grafts from each other (A) and respond differently to immunization with a model protein antigen (usually a simple polypeptide) (B). Downloaded from: StudentConsult (on 4 January 2008 02:06 PM) © 2005 Elsevier
Genetic polymorphism Homozygosity Heterozygosity
Alloantisera Alloantibodies Alloantigens
Inbred mice: Syngeneic, homozygous at all loci. Different inbred strains are allogeneic, at least in some loci. (Outbred mice)
Creation of a congenic mouse strain. Strain A Strain B aa bb Interbreeding F1 F2 Selection of allele b homozygotes aa ab ab bb Backcross Strain A Interbreeding Congenic mouse strain (Paul) Strain A.B
Polygenicity Polymorphism Haplotypes Linkage disequilibrium
TABLE 7.2 Examples of Linkage Disequilibrium between HLA Alleles *Linkagcs arc calculated by multiplying gene frequencies of individual alleles. For example A1/B8 has frequencies of 14.9% and 8.2%; thus, 0.149 X 0.082 = 0.0122. Expected linkages arc derived by calculation; observed linkages arc actual values within the population. (Values are rounded to the fourth decimal place.) Disequilibrium reflects difference between observed and expected linkages between dissimilar alleles. For example, for A1/B8 these values are 0.0122 and 0.0641; thus, 0.0641 - 0.0122 = 0.0519. When multiplied by 1,000, this yields 51.9.
Structure of a class I MHC molecule Figure 5-4 Structure of a class I MHC molecule. The schematic diagram (left) illustrates the different regions of the MHC molecule (not drawn to scale). Class I molecules are composed of a polymorphic α chain noncovalently attached to the nonpolymorphic β2-microglobulin (β2m). The α chain is glycosylated; carbohydrate residues are not shown. The ribbon diagram (right) shows the structure of the extracellular portion of the HLA-B27 molecule with a bound peptide, resolved by x-ray crystallography. (Courtesy of Dr. P. Bjorkman, California Institute of Technology, Pasadena, California.) Downloaded from: StudentConsult (on 4 January 2008 02:06 PM) © 2005 Elsevier
Structure of a class II MHC molecule Figure 5-6 Structure of a class II MHC molecule. The schematic diagram (left) illustrates the different regions of the MHC molecule (not drawn to scale). Class II molecules are composed of a polymorphic α chain noncovalently attached to a polymorphic β chain. Both chains are glycosylated; carbohydrate residues are not shown. The ribbon diagram (right) shows the structure of the extracellular portion of the HLA-DR1 molecule with a bound peptide, resolved by x-ray crystallography. (Courtesy of Dr. P. Bjorkman, California Institute of Technology, Pasadena, California.) Downloaded from: StudentConsult (on 4 January 2008 02:06 PM) © 2005 Elsevier
Polymorphic residues of MHC molecules Figure 5-5 Polymorphic residues of MHC molecules. The polymorphic residues of class I and class II MHC molecules (shown as red circles) are located in the peptide-binding clefts and the α-helices around the clefts. In the class II molecule shown (HLA-DR), essentially all the polymorphism is in the β chain. However, other class II molecules in humans and mice show varying degrees of polymorphism in the α chain and usually much more in the β chain. (Courtesy of Dr. J. McCluskey, University of Melbourne, Parkville, Australia.) Downloaded from: StudentConsult (on 4 January 2008 02:06 PM) © 2005 Elsevier
Antigen competition for T cells; one MHC molecule only accommodates one peptide. Figure 5-7 Antigen competition for T cells. A T cell recognizes a peptide presented by one MHC molecule. An excess of a different peptide that binds to the same MHC molecule competitively inhibits presentation of the peptide that the T cell recognizes. APC, antigen-presenting cell. Downloaded from: StudentConsult (on 4 January 2008 02:06 PM) © 2005 Elsevier
Expression of MHC molecules: Class I: Virtually all nucleated cells. Class II: Dendritic cells, B lymphocytes, macrophages.
Codominant expression
Enhancement of class II MHC expression by IFN-γ Figure 5-10 Enhancement of class II MHC expression by IFN-γ. IFN-γ, produced by NK cells and other cell types during innate immune reactions to microbes, or by T cells during adaptive immune reactions, stimulates class II MHC expression on antigen-presenting cells (APCs) and thus enhances the activation of CD4+ T cells. IFN-γ has a similar effect on the expression of class I MHC molecules and the activation of CD8+ T cells. Downloaded from: StudentConsult (on 4 January 2008 02:06 PM) © 2005 Elsevier