Download
1 / 27
270 likes | 445 Views
DIFC 2011Economic Activity Survey . DIFC 2011 Economic Activity Survey Report Value Added Accounting of DIFC Presentation to Media Roundtable 25 July 2012 Dr. Nasser Saidi, Chief Economist, DIFC . Agenda. Objectives of the DIFC Economic Activity Survey.

E N D
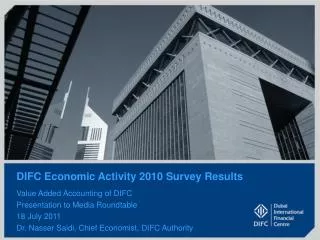
DIFC 2011Economic Activity Survey DIFC 2011 Economic Activity Survey Report Value Added Accounting of DIFC Presentation to Media Roundtable 25 July 2012 Dr. Nasser Saidi, Chief Economist, DIFC
Agenda Objectives of the DIFC Economic Activity Survey Distribution of DIFC Companies by Economic Activity GDP By Type of Economic Activity in DIFC Breakdown of GDP By Type of Economic Activity in DIFC for 2011 Employment and Education in the DIFC Assets and Liabilities, Paid up Capital and Ownership
Objectives of the DIFC Economic Activity Survey • Measure the size and level of economic performance of the DIFC sub-economy and its contribution to Dubai’s and the UAE’s GDP. • Estimate & make projections of the trend and rate of DIFC economic growth in relation to other countries’ financial sectors and/or regional financial centers. • Help businesses in assessing future demand for their services & products. • Understand the sectorial activities structure of the DIFC sub-economy and its variations. • Assist the DIFC authorities formulate strategy and design development plans and policies. • Develop strategic targets for different business sectors in the DIFC.
Survey Conducting Process: General Overview • Data for the 2011 DIFC Economic Activity Survey were collected through DIFCSTAT, the online portal that provides companies with a secure, interactive and web-based platform for reporting and storage of company data. • The survey questionnaire consisted of 8 sections designed to collect wide range of data, including value added, assets/liabilities, ownership structure, and workforce characteristics. Methodology of value added compilation was in line with the UN-OECD National Income Accounting Standards. • Response ratio for the current survey increased to reach 65.2% (63.5% for the 2010 Survey). The number of reporting entities was up by 8.6% compared to the previous survey, while total number of companies at the center increased by 5.7%. • Following online submission, Economics Department staff review the responses to ensure data quality and integrity. In some cases, survey questionnaires were returned to respondents with a request to review provided data and re-submit survey forms. This is believed to ensure sufficient quality of survey responses. • While every effort was made to verify submitted data, we cannot guarantee their accuracy, as we are not in a position to conduct on-site verification or audit of data. Therefore, we rely on the data provided by companies. • We estimate total value added or the equivalent of GDP and use the terms interchangeably. 4
Distribution of DIFC Companies by Economic Activity • The number of entities registered at the DIFC, excluding those obtaining licenses and pending dissolution or liquidation, was estimated at 817* in 2011. This number represents the companies that contributed to the centre’s value added in 2011. • Growth rate was 5.7% when compared to the end of 2010. Source: DIFC Economics *Total number of registered entities was 848 as of end of 2011
Distribution of DIFC Companies by Economic Activity • The number of registered entities that were active at the DIFC (excluding those under formation and pending dissolution or liquidation) was estimated at 817 in 2011. Growth rate was 5.7% when compared to the end of 2010. • At end December 2011, there were 330 active DFSA-regulated and 487 active non-DFSA regulated companies at the Centrein addition to public administration, government & the DIFC Courts. • They represented 40.4% and 59.6% respectively of companies operating at the DIFC. • The regulated firms included 279 Authorized Firms, 49 Ancillary Service Providers and 2 Authorized Market Institutions(Nasdaq-Dubai and DME). Source: DIFC Economics
GDP By Type of Economic Activity in DIFC • This fifth survey of Economic Activity at the DIFC places the total value added of the DIFC sub-economy at USD 3,127.4 million or approximately 1.4% of UAE’s non-hydrocarbon GDP as estimated by the IMF. • Breakdown by type of economic activity shows that financial sector accounted for 70.3% of the total value added within the DIFC (in 2010 – 72.0%), while the business services – for 28.0% (26.5%).Public administration (DIFCA, DFSA, DIFC Courts) reported only a small contribution of 1.6%. Source: DIFC Economics
Comparison with Previous Years According to the estimates, nominal GDP of the DIFC entities increased from USD 2,923.8 million in 2010 to 3,127.4 in 2011, or by 7%, a notably high rate when compared to financial sectors of advanced economies. However, DIFC’s nominal GDPgrowth rate was similar to that of the peer financial centers in Asia. Source: DIFC Economics
Detailed Breakdown of GDP By Type of Economic Activity in DIFC for 2011
DIFC Value Added By Type of Economic Activity in DIFC for 2011 • The major part of the 2011 nominal value added, 70.3%, was generated by financial sector entities. • Growth rates across companies were quite diverse: Business services grew at a fast pace (+13.1%) compared to that of Financial sector (+4.5%). • However, a substantial portion of nominal GDP growth was supported by non-financial companies: 49.9% of incremental GDP was produced by business sector entities, compared to 46.2% of financial companies. Source: DIFC Economics
Financial Sector Value Added in DIFC, 2011 • Within the financial service activities class (K64), Monetary Intermediation accounted for some 16.4% of sector value added; the largest contribution was from Holding companies, 18.2%; Trusts and funds contributed 17.6%. • The financial auxiliary class (K66) that comprises Managing Assets, Advising on Financial Products or Credit, Providing and Arranging Custody, Operating an Exchange etc. contributed an overall 42.7%. • The insurance sub-sector (mainly re-insurance) contribution was small at 5.2%. Source: DIFC Economics
Business services Sector value Added in DIFC, 2011 • Business activities were dominated by Professional, Scientific and Technical Activities sub-sector, which generated 66.9% of the sectoral GDP. Within this class, Legal & Accounting sectors, and Management Consultancy contributed 35% and 34% respectively. • Legal and Accounting firms together with companies providing Management consultancy were among the most active entities, adding 29% and 22% respectively to the value added generated by the DIFC’s Business Activities sector Source: DIFC Economics
DIFC Companies’ Assets and Liabilities* (USD mln) • Total assets of the DIFC economy as of 2011 were estimated at around USD 115 bln, of which USD 109 bln were financial assets. • Paid up capital of DIFC registered entities reached USD 29.5 bln as of end of 2011. Source: DIFC Economics *Estimated preliminary data
Ownership of Paid-Up Capital • According to the responses, around 1/3 of DIFC’s aggregate paid up capital is owned by UAE residents. • Holding companies account for 37.5% of consolidated paid up capital, and head offices for another 34.4%. • Paid up capital of monetary intermediates represents only 1.1% of total paid up capital, due to the fact that most of the entities from this group are branches. Source: DIFC Economics
Geographical diversity of UCPs • According to estimates, the largest share of Ultimate Controlling Parents (UCPs) is represented by the UAE with 17%, followed by the US and UK with 15% each. • From the GCC region, Saudi Arabia represents 3% of all UCPs and Kuwait (2%). Source: DIFC Economics Out of 533 responding entities, around 400 disclosed their UCP’s country of incorporation. The concept of ultimate controlling parent is not applicable to the rest 135 responding companies, as most of them are owned by individuals
Employment at the DIFC: Overview • Total number of people working at the DIFC as of end of 2011 was estimated at 12,945, which is 16% higher compared to the end of 2010 (est. at 11,162 persons). Note that this does not imply that all were working during 2011. • According to the survey, 55.6% of total workforce was employed in the financial sector companies, and 41.7% by other business entities, while around 2.7% were in public administration sector. • UAE nationals represented 2.2% of the total workforce. • Interestingly, number of expatriate males is around 2 times the number of expatriate women while among UAE nationals the female to male ratio is closer to 1. Source: DIFC Economics Distribution of workforce by sex Distribution of workforce by Sector
Breakdown of DIFC Workforce, by Sectors • The largest number of people were employed in entities involved in activities auxiliary to financial services (30.6% of total DIFC workforce), followed by legal firms (13.9%), and monetary intermediation entities (13.7%) Source: DIFC Economics Breakdown of DIFC Workforce by Sector (No. of people; percentage)
Educational Attainment of the DIFC Workforce • By education, the DIFC workforce constitutes 67% university graduates, while about 21% hold post-graduate degrees. • Similar to 2010, around 85% of both men and women are university graduates and above, underscoring the availability of a highly skilled workforce at the Center. Source: DIFC Economics
Value Added per Person Employed, Financial Sector Nominal value added per person employed in Trusts and Funds, and Holding Companies, considering the nature of their businesses, was the highest among the financial sector companies at the DIFC in 2011. Source: DIFC Economics
Value Added per Person Employed in Business Sector Management Consultancy, and Information and Communication companies were among the leaders of Business sector entities in 2011 in terms of value added generated per person employed. Source: DIFC Economics
Occupational Distribution of Workforce in DIFC • Managers represent a significant share of the total workforce in financial sector, while in business services sector service workers play an important role. • On average, 50-60% of workforce, across all type of entities at the center, is represented by specialists and technicians, 15-20% by managers, and another 20-30% by service workers. Source: DIFC Economics
Economic Activity Survey 2011 Project Team DIFC Economics: - Dr. Nasser Saidi E-mail: nasser.saidi@difc.ae Tel: +971 4 362 2550 - Beknazar Amanov E-mail: c-Beknazar.Amanov@difc.ae Tel: +971 4 362 2386 - Aathira Prasad E-mail: aathira.prasad@difc.ae Tel: +971 4 362 2478 - Cristina Attanasi E-mail: i-Cristina.Attanasi@difc.ae Tel: +971 4 362 2421 DIFCSTAT: - Nadine Chaar E-mail: nadine.chaar@difc.ae Tel: +971 4 362 2560