Download
1 / 22
220 likes | 224 Views
This presentation discusses the small-scale characteristics of the 45 GHz band based on channel measurement. It covers transmission scenarios, channel measurement setup, power delay profile, angle of arrival and departure, and time of arrival.

E N D
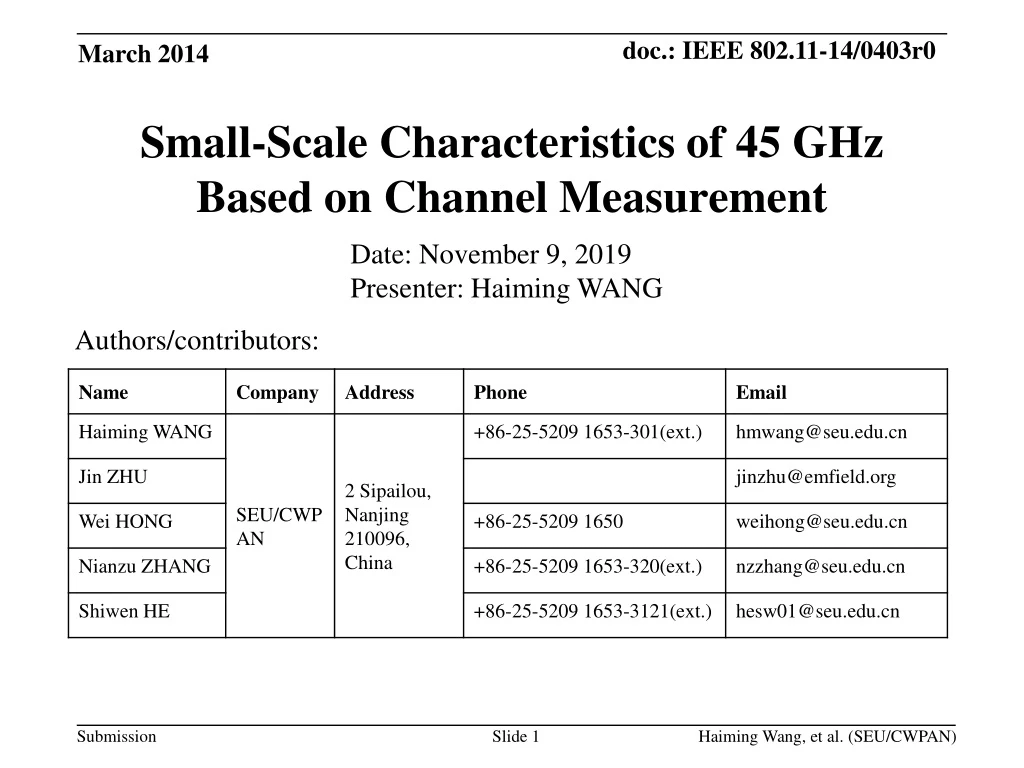
Date: March 19, 2014 Presenter: Haiming WANG Small-Scale Characteristics of 45 GHz Based on Channel Measurement Authors/contributors: Haiming Wang, et al. (SEU/CWPAN)
This presentation gives small-scale characteristics of 45 GHz band based on channel measurement. Abstract Haiming Wang, et al. (SEU/CWPAN)
Channel Measurement Scheme • Transmission Scenarios • Channel measurement setup • Small-Scale Characteristics at 45 GHz band • Number of clusters and rays • Power delay profile • Angle of arrival and departure • Time of arrival Outline Haiming Wang, et al. (SEU/CWPAN)
Conference room Cubicle room Living room Transmission Scenarios Haiming Wang, et al. (SEU/CWPAN)
Conference Room Scenario Setup • Tx height: 1.95m • Rx height: 1.00m • Fixed Tx position and 4 Rx positions • Txheight: 10 dBm • Freq center: 44.955GHz • Sampling frequency: 660 MHz • Number of Subcarriers: 256 Haiming Wang, et al. (SEU/CWPAN)
Channel Measurement Setup • A PC is used to not only control the rotary table with an RS-232 port but also control the signal generator and vector network analyzer (VNA) with LAN ports. • The signal generator transmits CW signal at each frequency, then Rx power and channel frequency response are obtained by the VNA. The positions of Tx and Rx antennas and measured data are simultaneously recorded. Haiming Wang, et al. (SEU/CWPAN)
Type II: Open-ended waveguide (OEW) antenna with 6-dBi gain Antennas for Channel Measurement • Type I: Horn antenna with 23.7-dBi gain H-Plane E-Plane Pattern (dB) Angle (degree) Haiming Wang, et al. (SEU/CWPAN)
Antennas for Channel Measurement • Type Ⅲ: SIW antenna with 3-dBi gain • Three antennas are linear polarized Maximum Gain Maximum Gain Gain Gain Gain Angle (deg) Angle (deg) Haiming Wang, et al. (SEU/CWPAN)
Frequency domain measurement • Complex response is recorded in the frequency domain • Channel impulse response is obtained from channel frequency response using IFFT Channel Measurement Technique Haiming Wang, et al. (SEU/CWPAN)
Horn-Horn: • Tx antenna rotates at each 10 degrees, Rx antenna rotates at each 10 degrees • OEW-OEW: • Tx antenna rotates at each 60 degrees, Rx antenna rotates at each 60 degrees Double-directional Scanning Haiming Wang, et al. (SEU/CWPAN)
andare the gain and channel impulse response of the ith cluster respectively; • Amplitude, delay and angle characteristics of clusters as well as rays can be derived from massive channel measurements. The Channel Impulse Response Function Haiming Wang, et al. (SEU/CWPAN)
Power Angle Profile (PAP) Haiming Wang, et al. (SEU/CWPAN)
PAP at Rx 1 Position • Sub-paths whose average power 20dB less than the max path power are ignored • Power of each sub-path is the expectation of powers of 256 sub-carriers (a) Average power of each angle (b) Delay of each angle Haiming Wang, et al. (SEU/CWPAN)
PAP at Rx2 Position • Sub-paths whose average power 20dB less than the max path power are ignored • Power of each sub-path is the expectation of powers of 256 sub-carriers (c) Average power of each angle (d) Delay of each angle Haiming Wang, et al. (SEU/CWPAN)
PAP at Rx 3 Position (e) Average power of each angle (f) Delay of each angle Haiming Wang, et al. (SEU/CWPAN)
PAP at Rx 4 Position Rx2 (g) Average power of each angle (h) Delay of each angle Haiming Wang, et al. (SEU/CWPAN)
Amount to 36×36 (1296) sub-channels are measured to analyze the spatial characteristics of clusters. The left illustration shows the average power of each path, the right illustration shows the corresponding delays of all paths. Clustering is obvious and there are about 6 or more clusters . Cluster with larger power usually has smaller time delay. Discussion Haiming Wang, et al. (SEU/CWPAN)
Power Delay Profile (PDP) Haiming Wang, et al. (SEU/CWPAN)
PDP of Horn-Horn Rx1 Rx2 Rx4 Rx3 Haiming Wang, et al. (SEU/CWPAN)
PDP of OEW-OEW Rx1 Rx2 Rx4 Rx3 Haiming Wang, et al. (SEU/CWPAN)
There is no LoS path component in the horn scanning setup for a misalignment of TR antennas while in OEW scanning setup there is no such effect. The first ray arrives at about 10ns as radio propagation when there is LoS component. The LoS component is of much significant comparing the reflection and scattering components. Discussion Haiming Wang, et al. (SEU/CWPAN)
Continue the small-scale channel measurement in other two transmission scenarios. Extract the distribution of parameters and finish the channel models based on channel measurement. Set up MIMO channel measurement and derive the relative correlation matrix. Give the Matlab code of channel generation at 45 GHz band. Future Work Haiming Wang, et al. (SEU/CWPAN)