Download
1 / 7
70 likes | 139 Views
Status report about evaluation of TOF stop counter. 2009.12.22 Hiroshi Kou. 1. TOF wall. up. 50. ・ TOF wall is consisted by 32 layer’s scintillator and the size is 1610×30×150. ( BC408 ) ・They have two photomultiplier which named up and down, respectively.

E N D
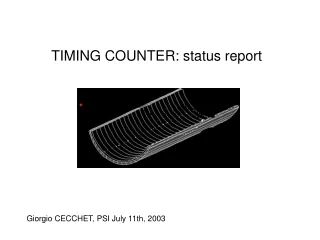
Status report about evaluation of TOF stop counter 2009.12.22 Hiroshi Kou
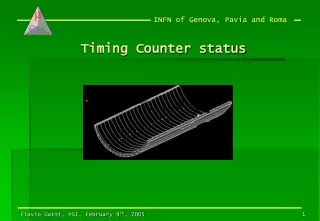
1.TOF wall up 50 ・TOF wall is consisted by 32 layer’s scintillator and the size is 1610×30×150. ( BC408 ) ・They have two photomultiplier which named up and down, respectively. ・Operational test (cosmic ray measurement for attenuation length and time resolution, 90Sr source measurement) was done on June 9th. ・The center of layer is 0cm, and Sr source test was done on 50cm, 25cm, 0cm, -25cm, -50cm, for each segment. ・I want to evaluate about attenuation length and time resolution. 25 … 0 -25 -50 down seg1 seg2 ・・・ Fig1.TOF stop counter
2.attenuation length λ:attenuation length 0 down up B’=Bexp{-(L+x)/λ} x A’=Aexp{-(L-x)/λ} ・A is compared with B. ・The layer’s thickness is 3cm. ・counter evaluation has been done by pulse hight of PMT’s signal. ・√A’B’ = √ AB×exp(-L/λ) -> const ・A’/B’ = A/B×exp(-2x/λ) -> will show accurate λ Fig2. about attenuation length
3.result fig3.raw data of ADC fig4.position vs A’/B’ • pedestal is subtracted •I evaluate about A’/B’ about ADC •make graph about position vs A’/B’ and fit exponential -> calculate attenuation length
4.summary count attenuation length(m) fig 6. histogram of attenuation length about all segment •average λ of all layer is 1.8m • No layers deviate from the average. •evaluation of √A’B’ and time resolution is in-progress
Appendix 2-1.end-point method ・Fit Gausian and choice 1/1000height position from peak .(Fig 3) ・subtract pedestal from 1/1000 height position (end-point) ・make graph about position vs end-point (Fig 4) and fit exponential -> can calculate the attenuation length ・calculate the attenuation length each segments end-point Fig 3. Raw date about ADC Fig 4. Position vs end-point
count ・end-point method show attenuation length 2.089m ・But Gaussian fitting is really suitable? ・I checked A’/B’ method attenuation-length (m) Fig 5.the histogram of attenuation length