Download

1 / 111
1.37k likes | 1.84k Views
Project Management - CPM/PERT. For planning, scheduling, monitoring and coordinating large and complex projects comprising a number of activities Defining the entire job to be done Formulating the logical sequence Controlling the progress. Network Analysis. Minimization of total time

E N D
For planning, scheduling, monitoring and coordinating large and complex projects comprising a number of activities Defining the entire job to be done Formulating the logical sequence Controlling the progress Network Analysis
Minimization of total time Minimization of total cost Mimimize production delays Objectives
Construction of bridges Assembly line scheduling Installation of complex equipment Inventory planning and Control Construction of residential complex Applications
Activity : represented by an arrow, definite starting time, and a point where it ends Predecessor Activity : An activity which must be completed before one or more other activities start Successor Activity : An activity which started immediately after one or more activities are completed Components
- Dummy Activity : any activity which does not consume time or resource ( -----) Event : represents the start of an activity and the end of an activity activity i j
Ei = earliest start time for activity (i,j) Li = latest start time for activity (i,j) Ej = earliest finish time for activity (i,j) Lj = latest finish time for activity (i,j) Critical Path Method
The longest continuous chain of activities through the network starting from the first to last event. ( ) All activities lying in this critical path are called critical activities as any delay in their execution will lead to a delay in the completion of the entire project. Critical Path
Total float : The amount of time by which an activity can be delayed without delay in the project completion date Free Float : The portion of the total float within which an activity can be manipulated without affecting floats of the subsequent activities Float
Independent Float : That portion of the total float within which an activity can be delayed for start without affecting floats of the preceding activities.
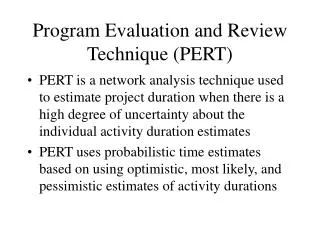
Completion time is considered to be unknown Probability of activity completion time is estimated – optimistic time (to or a) pessimistic time (tp or b ) normal time / most likely time (tm or m) PERT programme evaluation and review technique
Expected time te / μ = 1/6 ( to + 4 tm + tp) Std deviation σ = 1/6 (tp – to) Variance σ² = ( 1/6 (tp – to))² Prob of completing the project by scheduled time (Ts) is given by : Prob ( Z ≤ Ts – μ) σ
For the following PERT diagram : D A 3 4 H 2 B E I K 2 4 5 3 F 7 2 C G 4 J 6 Q 3 2 9 4 7 8 1 6 5
Compute earliest event time and latest event time Critical path and total project duration
E1 =0 E2= E1 + t1,2 = 0 + 3 E3 = E2 + t2,3 = 3 + 4 = 7 E4 = E1 + t1,4 = 0 + 2 = 2 E5 = E1 + t1,5 = 0 + 2 = 2 E6 = max ( E4 + t4,6 ; E5 + t5,6 ) = max ( 9, 6 ) = 9 Forward pass method
E7 = E4 + t4,7 = 2 + 4 = 6 E8 = max ( E3 + t3,8 ; E7 + t7,8 ) = max ( 9, 11) = 11 E9 = max ( E8 + t8,9 ; E6 + t6,9 ) = max ( 14, 15) = 15 Lower left portion
L9= E9 = 15 L8 = L9 – t8,9 = 15 -3 =12 L7 = L8 – t7,8 = 12-5 =7 L6 = L9 – t 6,9 = 15 – 6 = 9 L 5 = L6 – t5,5 = 9-4 = 5 L4 = min( L6- t4,6; L7-t4,7) min( 9-7 ; 7 - 4) = 2 Backward Pass Method
L3 = L8 – t 3,8 = 12 -2 = 10 L2= L3- t2,3 = 10 -4 = 6 L1= min ( L2-t1,2 ; L4- t1,4; L5 – t1,5) = min ( 6-3; 2-2; 5-2 ) = 0
For the following PERT diagram : D A 3 4 H 2 B E I K 2 4 5 3 F 7 2 C G 4 J 6 3 7 10 2 3 6 9 15 15 4 2 2 7 6 7 8 11 12 1 0 0 6 9 9 5 2 5
An established company has decided to add a new product to its line. It will buy the product from a mfg concern, package it, and sell it to a number of distributors selected on a geographical basis. Market Research has indicated the volume expected and the size of sales force reqd. the steps in the following table are to be planned : Q
What is the critical path Calculate total and free float
6 3 2 3 2 2 4 14 4 3 3 2 3 3 3 5 4 4 20 7 23 26 10 26 29 12 31 31 13 34 34 1 0 0 6 20 20 9 24 28 2 2 2 3 6 6 5 4 20 8 23 23 11 28 28
Total float : The amount of time by which an activity can be delayed without delay in the project completion date = (Lj – tij) - Ei Free Float : The portion of the total float within which an activity can be manipulated without affecting floats of the subsequent activities = (Ej – Ei) - tij
Construct a network diagram Compute the total float Find the critical path and total project duration
4 1 5 7 1 1 8 2 9 10 15 2 4 9 10 22 22 4 5 10 1 0 0 7 15 15 • 8 • 17 3 1 1 5 7 7 6 11 16
Critical path is 1-3-5-7-8-10 and the project duration is 22 days Total Float = ( Lj-tij ) - Ei
Draw a network diagram Time estimates are obtd - m , a , b Calculate te Determine the critical path Calculate σ² Calculate Z steps in developing PERT network
Various activities of a small project and other relevant information have been shown in the adjoining table. Using the given info the resulting network is shown in the following figure. Map out the critical path and find the prob of completing the project within 48 days. Q
Calculate expected time te = a + 4m + b 6 Variance σ² = b-a ² 6
E(μ1)= 0 E(μ2) = 0+8 = 8 E (μ3) = 8 + 4 = 12 E(μ4)= 12 + 8 = 20 E(μ5) = Max(12+5,20+0) = 20 E(μ6) = 20+6 = 26 Earliest Start Time
E (μ7) = 20 + 6 = 26 E(μ8)= 20 + 6 = 26 E(μ9) = Max(26+8, 26+5) = 34 E(μ10) =Max(34 + 10, 26 + 6 ) = 44
E(L10) = 44 E(L9) = 44-10 = 34 E(L8) = 34 – 5 = 29 E(L7) = 34 – 8 = 26 E(L6) = 44-10 = 34 E(L5) = Min (26-6, 29 -6) = 20 Latest StartTime
E(L4) = Min(20 – 0, 36 – 6 ) = 20 E(L3) = 20 – 5 = 15 E(L2) = Min(15-4, 20 -12) = 8 E(L1) = 8 – 8 = 0 Draw network diagram and find critical path
3 12 15 7 26 26 9 34 34 1 0 0 5 20 20 2 8 8 8 28 29 4 20 20 10 44 44 6 26 38
Critical path is 1---2---4---5---7----9---10 Expected time in completing the project 8 + 12 + 0 + 6 + 8 + 10 = 44 days Project variance 1.78 + 1.78 + 0 +1 + 1.78 + 4 = 10.34
To find out the prob of completing the project, within , 48 days Z = X - X¯ = 48 – 44 = 1.24 σ 3.216 value from normal tables = 0.8925 Hence prob of completing project within 48 days = 89 %
A small project consists of seven activities for which the relevant data are given : Draw the network and find the project completion time Q (Dummy Variable )