Download
1 / 47
470 likes | 600 Views
Galaxy Ecology. The role of galaxy environment in determining the star formation history of the universe. Michael Balogh ICC, University of Durham. Plus: Richard Bower, Ian Smail, Simon Morris, Vince Eke (Durham) Ian Lewis and the 2df team

E N D
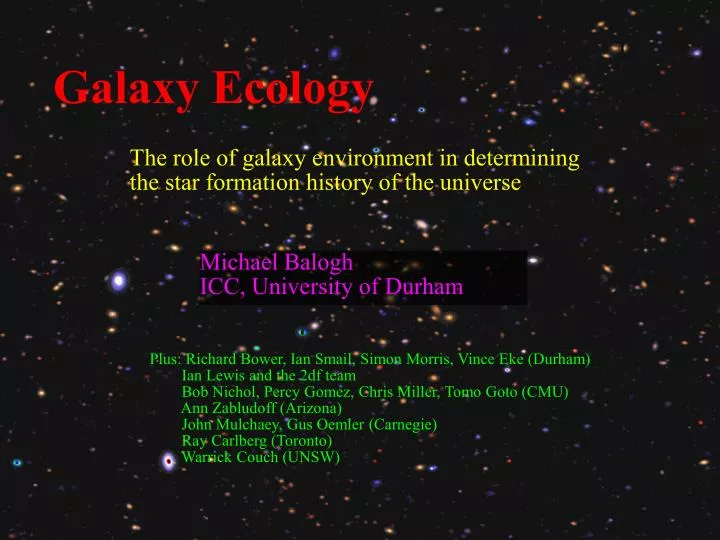
Galaxy Ecology The role of galaxy environment in determining the star formation history of the universe Michael Balogh ICC, University of Durham Plus: Richard Bower, Ian Smail, Simon Morris, Vince Eke (Durham) Ian Lewis and the 2df team Bob Nichol, Percy Gomez, Chris Miller, Tomo Goto (CMU) Ann Zabludoff (Arizona) John Mulchaey, Gus Oemler (Carnegie) Ray Carlberg (Toronto) Warrick Couch (UNSW)
Galaxy Ecology The role of galaxy environment in determining the star formation history of the universe Michael Balogh ICC, University of Durham Motivation: cosmological context of observations Clusters at intermediate redshift The local universe: 2dF galaxy redshift survey, and Sloan digital sky survey Low mass clusters and groups at intermediate redshift
Why Does Star Formation Stop? B) External? Hierarchical build-up of structure inhibits star formation A) Internal? i.e. gas consumption and “normal” aging Steidel et al. 1999 SFR ~ (1+z)1.7 (Wilson, Cowie et al. 2002)
Groups Clusters A Press-Schechter plot showing the growth of the mass structure of the universe • LCDM cosmology • Rapid growth of structure Renormalised relative to 1011 Msol
Abell 2390 (z~0.23) 3.6 arcmin R image from CNOC survey (Yee et al. 1996) Butcher-Oemler effect? Does star formation take place in clusters at z>0 ?
Ha in Abell 2390 Balogh & Morris 2000 3.6 arcmin
300 200 100 0 -100 -200 -300 -200 -100 0 100 200 AC114 (z=0.31) (Couch et al. 2001) DRA DDec
Nod & Shuffle: LDSS++ (AAT) band-limiting filter + microslit = ~800 galaxies per 7’ field
Ha in Rich Clusters at z~0.3 LDSS++ with nod and shuffle sky subtraction, on AAT (Field) Couch et al. 2001 ApJ 549, 820 Balogh et al. 2002 MNRAS, 335, 110
Fine for clusters – but what about groups? Groups Clusters
Ram-pressure stripping Needs dense ICM and high velocities - clusters Collisions / harassment Groups are preferred place! "Strangulation" Removal of the gas halo Similar to ram-pressure stripping but much easier! Mechanisms
Ram pressure - simulations from Quilis et al. 2000 ICM Gunn & Gott, 1972
Examples of galaxy collisions in the real universe and in a simulation (Moore et al 1995)
Strangulation: removal of the gas halo Could occur in groups First suggested by Larson, Tinsley & Caldwell, 1984
Strangulation ? Use numerical model of infall to estimate timescale for disruption of SFR Radial gradients in CNOC clusters suggest t ~2 Gyr (Balogh, Navarro & Morris 2000)
2dFGRS (Lewis et al. 2002, MNRAS 334, 673) Ha in 11000 galaxies within 20 Mpc of 17 clusters, down to MB=-19 SFR-density, SFR-radius relations in clusters with s>400 km/s SDSS (Gomez et al. 2003, ApJ 584, 210) volume-limited sample of 8600 galaxies from the EDR, MR<-20.5 SFR-density relation independent of proximity to a cluster The Local Universe
Galaxy Transformation in the 2DF survey • Data for 17 Abell-like clusters • Covers velocity dispersions • 500 km/s - 1100 km/s • Region out to > 20 Rvir extracted from the survey • Major advantages: • ● Star formation rate measured from Ha • ● Complete redshift information - no need to subtract background! • ● Compare with surrounding field directly A1620 Rvir 1 degree (data extracted over ~7 deg field)
SFR-Environment Relation in the 2dFGRS Field SFR-Radius Relation Field Field Lewis et al. 2002 MNRAS 334, 673
SFR-Environment Relation in the 2dFGRS Field SFR-Density Relation Field Field Lewis et al. 2002 MNRAS 334, 673
SFR-Environment Relation in the 2dFGRS Field SFR-Density Relation c.f. Morphology-Density Relation R>2 Rvirial Field Field Lewis et al. 2002 MNRAS 334, 673
SFR-Environment relation in the SDSS Gomez et al. (2003) Field 75th percentile Star Formation Rate (Mo/yr) 75th percentile Median Field median Galaxy Surface Density (Mpc-2)
Low-Lx Clusters at z=0.25 Factor ~10 less massive than CNOC clusters HST imaging, extensive ground-based spectroscopy CNOC2 groups at z=0.45 Spectroscopy with LDSS-2 on Magellan 6.5-m Goal is complete group membership to M*+1 Groups at z=0.2-0.5
Low Lx Clusters at z~0.25 Cl0841 z=0.24 s=390 Cl0849 z=0.23 s=750 Cl1701 z=0.24 s=590 Cl1702 z=0.22 s=370 Cl0818 z=0.27 s=630 Cl0819 z=0.23 s=340 Cl1309 z=0.29 s=640 Cl1444 z=0.29 s=500 Lx ~ 1043 - 1044 ergs/s, ~ 10 X less massive than CNOC
Morphologies in Low-Lx Clusters at z~0.25 Bulge/Total Fractions from GIM2D (Simard et al. 2002) Disks B/T<0.4 Intermediate Bulges B/T>0.6 Balogh et al. 2002, ApJ 566, 123
Low-Lx Disk Fractions (from Medium Deep Survey) High-Lx Clusters from the lensing sample of Smith et al. 2001 Balogh et al. 2002, ApJ 566, 123
Morphology-density relationat z~0.25 Balogh et al. 2002 ApJ 566, 123
Bulge Creation or Disk Destruction? Balogh et al. 2002, ApJ 566, 123 Disk Luminosity Functions (at fixed density)
Bulge Creation or Disk Destruction? Balogh et al. 2002, ApJ 566, 123 Bulge Luminosity Functions (at fixed density)
Star Formation in Low-Lx Clusters Spectroscopy for 172 cluster members Mr< -19 (h=1) SFR from [OII] emission line Balogh et al. (2002) MNRAS, 337, 256 Balogh et al. 1997
Disks Without Star Formation Cl 1309 id=83 z=0.2934 B/T = 0.39 Wo (OII)=-2.64.0 Wo (Hd)=3.8 2.1 [OII] 3” HST Image
Disks Without Star Formation [OII] Cl 1444 id=78 z=0.2899 B/T = 0.42 Wo (OII)=3.5 2.7 Wo (Hd)=4.9 1.3 3” HST Image
Disks Without Star Formation Cl 0818 id=58 z=0.2667 B/T = 0.19 Wo (OII)=-9.6 7.8 Wo (Ha)=22.1 11.6 Wo (Hd)=2.0 3.6 [OII] 3” HST Image Ha
Disks Without Star Formation Cl 0841 id=20 z=0.2372 B/T = 0.42 Wo (OII)=-0.2 1.2 Wo (Ha)=-1.4 0.6 Wo (Hd)=0.0 0.6 [OII] 3” HST Image Ha
Bulge formation may be more efficient in more massive clusters but star formation in disks is suppressed in all clusters Low-Lx Clusters: Summary
The CNOC2 redshift survey was aimed at measuring correlation strengths and star formation rates in the z=0.5 universe. Group selection and inital look at properties described in Carlberg et al 2001 Durham involvement: follow-up observations with Magellan to gain higher completeness confirming complete samples of group members using LDSS-2. Overall aim of comparing star formation rates in groups at z=0.5 and locally (Mulchaey & Zabludoff etc, 2dfgrs coming soon!) The CNOC2 groups project Bower, Mulchaey, Oemler, Carlberg et al - in prep.
CNOC2 Groups at z~0.45 Deep spectroscopy with LDSS-2 on Magellan 1 Infrared (Ks) images from INGRID Combined with CNOC2 multicolour photometry and spectroscopy, we can determine group structure, dynamics, stellar mass, and star formation history.
LDSS2 on Magellan [OII] [OII]
CNOC2 Groups at z~0.45 Preliminary results based on only 12 CNOC2 groups Have observed >30 groups to date Balogh et al. 1997
Wilson et al. 2002 CNOC2 Groups ? CNOC1 Field SDSSField CNOC1 Clusters Low-Lx Clusters SDSS Clusters Putting it all together… 20 15 Mean EW [OII] (Angstroms) 10 5 0 0.3 0.5 1.0 Redshift
Local Groups in the 2dFGRS Based on friends-of-friends catalogue (V. Eke) Mean SFR appears to be suppressed in all galaxy associations at z=0! So where is star formation going on??
Galaxy pairs Dv < 100 km/s
Wilson et al. 2002 CNOC2 Groups ? CNOC1 Field SDSSField CNOC1 Clusters Low-Lx Clusters ? 2dF Clusters The Environmental-Madau plot 20 15 Mean EW [OII] (Angstroms) 10 5 0 0.3 0.5 1.0 Redshift
2dFGRS and SDSS: SFR-density relation shows critical density at 1 Mpc-2 SFR suppressed in all dense regions, in structures more massive than groups Lack of strong evolution in clusters + abundance of structure above the critical threshold suggests environmental processes are important to global evolution. BUT: Strong evolution in group SFRs? Summary