Download
1 / 55
550 likes | 658 Views
Model Description. Model Overview. Written in Java Open Source / cross platform 71 source files After encountering memory issues: Switched to a pre-compiled version of the program (Excelsior JET package) 4 other programmers: Roger Schlachter, Chris Schmitt, Andy Kuhn, and Andy Korth

E N D
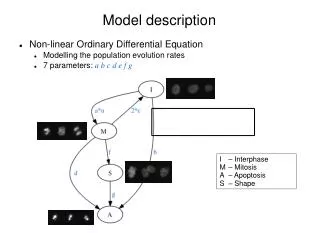
Model Description
Model Overview Written in Java Open Source / cross platform 71 source files After encountering memory issues: Switched to a pre-compiled version of the program (Excelsior JET package) 4 other programmers: Roger Schlachter, Chris Schmitt, Andy Kuhn, and Andy Korth Assistance from several JAVA library developers
Model Description • Overall Data Requirements: • Site Properties • Cover Properties
1. Site Properties • Latitude • Longitude • Needed for climate simulation • Size of landfill – total waste footprint (acres) Also available through SWIS database
SWIS Search • SWIS database
2. Cover Properties Panel • Up to 10 different covers allowed in each model run
Cover Panel: Cover Details • Cover type: • Daily, Intermediate, or Final • Coverage % • Area coverage at the site for this particular cover type
Default Boundary Conditions * Field data actually significantly lower (3000 ppm Marina and 3 ppm Scholl)
Cover Panel: Cover Details Cover Properties scroll bars • Organic Matter content • Gas Recovery • Vegetation Presence
Organic Matter Percentage • Impacts hydraulic conductivity and water holding capacity (Benjamin et al., 2008) • Low to High corresponds to 0 to 5%
Cover Panel: Gas Recovery • Gas Recovery Percentage • This is NOT the recovery “efficiency” • Indicates the spatial coverage of the gas recovery system for that particular cover
Vegetation Percentage • Estimated on surface coverage of vegetation • Main impact: • Decreases incident solar radiation to the soil surface • Reduces heating and soil surface evaporation
Cover Editor : • Once layer highlighted: • Edit layer material – 33 different materials • 12 Textural soil types (USDA soil classifications) • SILTY CLAY, CLAY, SILTY CLAY LOAM, SILT, CLAY LOAM, SILTY LOAM, SANDY CLAY, LOAM, SANDY CLAY LOAM, SANDY LOAM, LOAMY SAND, SAND
Cover Editor : • Once layer highlighted: • Edit layer material • 12 Soil types (USDA soil classifications) • SILTY CLAY, CLAY, SILTY CLAY LOAM, SILT, CLAY LOAM, SILTY LOAM, SANDY CLAY, LOAM, SANDY CLAY LOAM, SANDY LOAM, LOAMY SAND, SAND • 21 Alternative Daily Covers and other materials • ADC Materials (e.g. tarps, foams, shredded tires, compost) • Other • Geomembranes (HDPE, LDPE, EDPM); Geotextiles • Rocks, Pebbles (pea gravel) • Contaminated soils • Foundry sands • Wood Chips
Cover Editor : • Once layer highlighted: • Edit layer material • Specify thickness of the materials • Layers arranged from top to bottom
Cover Editor: • Once layer highlighted: • Edit layer material • Specify thickness of the materials • Layers arranged from top to bottom
Default Final Covers • If the cover type of final cover is selected • 5 default final cover designs are in a pull down combo box
Default final cover designs * Minimum layer size = 1 inch. HDPE is modeled as 40 micron HDPE with sand
3. Simulated Weather • CALMIM uses 3 previously validated simulation models • GlobalTempSIM • GlobalRainSIM • SolarCalc
Oroville, CA (2009) Comparisons of Weather Simulator Fresno, CA (2009) Long Beach, CA (2009) Weather Data from Weather Underground
Oroville, CA (2009) Comparisons of Weather Simulator Fresno, CA (2009) Long Beach, CA (2009) Weather Data from Weather Underground
Soil Temperature and Moisture Model • Uses STM2 model (Spokas and Forcella, 2009) • Some modifications: • Moisture boundary conditions – • Upper = evaporation/precipitation boundary • Lower = saturated or free drainage {saturated default condition} • Temperature boundary conditions – • Upper temperature boundary • Air temperature (simulated) or fixed temperature • Lower temperature boundary: • Function of cover type: • Daily : Average annual air temperature • Intermediate : 40 oC • Final : 45 oC
Gas Modeling • Uses already developed 1-D gas transport model (Campbell, 1985) • Added empirical soil oxidation equations from laboratory testing for methanotrophic methane oxidation – specific for CA soils • 1-D Oxygen diffusion modeled • 1-D Methane diffusion modeled • With and without CH4 oxidation
Supporting Laboratory Studies for Methane Oxidation Modeling • A total of 2,112 soil incubations have been completed using Marina and Scholl Canyon cover soils • Temperature range of 0-70 C and moisture range of -15 bar to zero soil moisture potential • Incubators: Isothermal and diurnal fluctuations • Detailed in published paper Spokas and Bogner, 2010.
Laboratory Methane Oxidation Testing • The soil moisture potential for oxidation for 50% of activity for the two validation sites -600 kPa • 27 oC maximum from lab data • 400 ug CH4 /gsoil/day average
Beta Testing • Initial testing conducted via USDA SharePoint server • Total # of registered users = 52 • Due to file compatibility issues (EXE files) and delay in getting individuals registered with SharePoint moved to http://calmim.lmem.us • 55 downloads of versions up to 4.0 • 83 downloads of version 4.2 (newest)
Beta Testing Results • 10 users provided detailed comments • Identified memory issues early on in the Beta testing • Java memory handling is poor; particularly for finite difference modeling • Reprogrammed calculation routines to avoid new variables; still occasional issues
Marina Landfill Comparison 15 cm (intermediate cover) and 50 cm depth (final cover)
Soil Moisture - MIC • Variable thickness of wood chips across area • Reduces evaporation losses and increase soil moisture (0-8” thickness) • Model with 2” wood chips
Marina Daily Cover Comparisons Different locations
MDC Model overestimates CH4 oxidation for Daily Covers
Rates of CH4 oxidation at various depths under 3 conditions: • No Pre-incubation at field-collected moisture • 60-day pre-incubation at field-collected moisture • 60-day pre-incubation at field-capacity moisture (33 kPa) no pre-incub; field moist. oxid. range = 0.05 -211 pre-incub; field moist. oxid. range = 0.1 - 384 pre-incub; field capacity oxid. range = 112 -644 (averages of 6 replicates; SD in parentheses)
MDC: Cover Thickness 8” 12” 16” 3000 ppm CH4 at base of cover Daily Cover Waste Field data 0.2 to 10.2 g/m2/day
MDC: Concentration at Base of Cover 12” 3000 ppm CH4 at base of cover Daily Cover 1000 ppm CH4 at base of cover 10000 ppm CH4 at base of cover Waste
MDC: Concentration at Base of Cover 12” 3000 ppm CH4 at base of cover Daily Cover 1000 ppm CH4 at base of cover 10000 ppm CH4 at base of cover Waste
Average Field Data Range Estimation From13C Isotope Probe Samples
Questions from Beta Testers • Why are the emission results for different landfill sizes (waste in place) the same, if the same cover and cover type (e.g. concentration profiles) are used? • The assumptions for this model: • Diffusion is the dominant transport mechanism: Concentration gradient controls gas transport If concentrations are equal, then emissions are equal Advection requires connectivity (e.g. soil cracks) for gas flow.