Download
1 / 1
10 likes | 144 Views
A. B. Shoot-trans. 21d plant. Flower 12. Flower 15. Flower 10. Flower 9. Silique 5. Silique 3. Silique 4. Seed 10. IAA. Zeatin. ABA. ACC. SA. JA. Root. Shoot. Inflor. Seed 6. Seed 7. Seed 8. Seed 9. AtGRX2. AtGRX2. AtGRX4. AtGRX3. AtGRX7. AtGRX4. CC-type. AtGRX10.

E N D
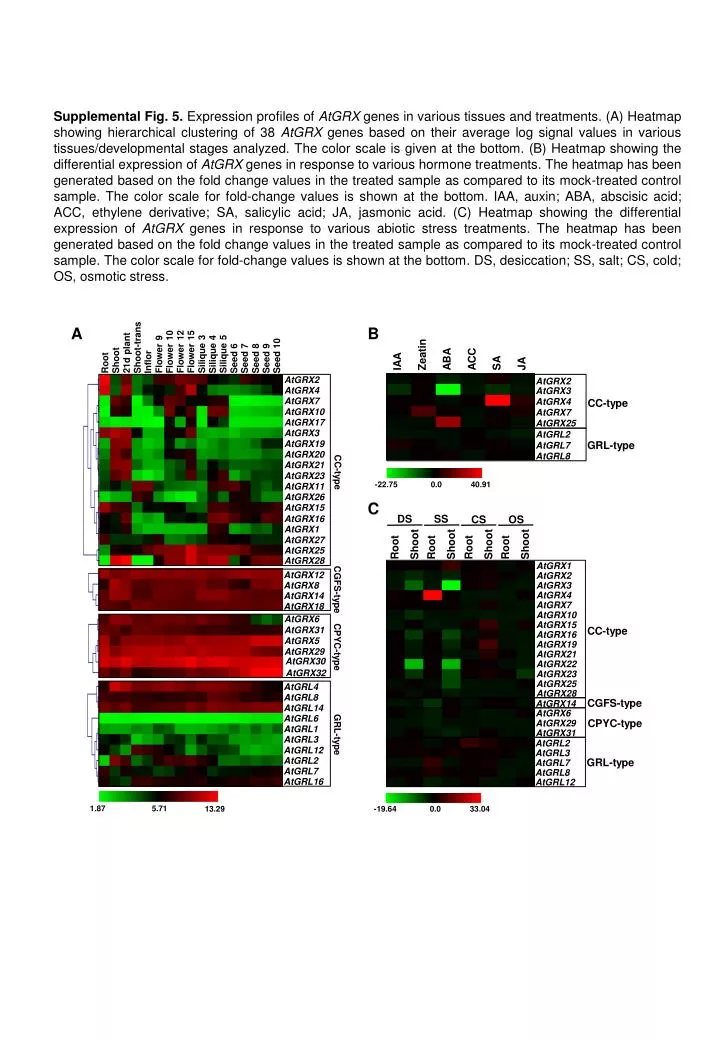
A B Shoot-trans 21d plant Flower 12 Flower 15 Flower 10 Flower 9 Silique 5 Silique 3 Silique 4 Seed 10 IAA Zeatin ABA ACC SA JA Root Shoot Inflor Seed 6 Seed 7 Seed 8 Seed 9 AtGRX2 AtGRX2 AtGRX4 AtGRX3 AtGRX7 AtGRX4 CC-type AtGRX10 AtGRX7 AtGRX17 AtGRX25 AtGRX3 AtGRX19 AtGRL2 AtGRX20 GRL-type AtGRL7 AtGRX21 CC-type AtGRL8 AtGRX23 AtGRX11 AtGRX26 C -19.64 -22.75 0.0 0.0 40.91 33.04 AtGRX15 DS SS CS OS AtGRX16 AtGRX1 Root Shoot Root Shoot Root Shoot Root Shoot AtGRX27 AtGRX25 AtGRX1 AtGRX28 AtGRX2 AtGRX3 AtGRX12 AtGRX4 CGFS-type AtGRX8 AtGRX7 AtGRX14 AtGRX10 AtGRX18 AtGRX15 AtGRX6 CC-type AtGRX16 AtGRX31 AtGRX19 AtGRX5 CPYC-type AtGRX21 AtGRX29 AtGRX22 AtGRX30 AtGRX23 AtGRX32 AtGRX25 AtGRX28 AtGRL4 CGFS-type AtGRX14 AtGRL8 AtGRX6 AtGRL14 CPYC-type AtGRX29 AtGRL6 AtGRX31 AtGRL1 GRL-type AtGRL2 AtGRL3 AtGRL3 AtGRL12 GRL-type AtGRL7 AtGRL2 AtGRL8 AtGRL7 AtGRL12 AtGRL16 1.87 5.71 13.29 Supplemental Fig. 5. Expression profiles of AtGRX genes in various tissues and treatments. (A) Heatmap showing hierarchical clustering of 38 AtGRX genes based on their average log signal values in various tissues/developmental stages analyzed. The color scale is given at the bottom. (B) Heatmap showing the differential expression of AtGRX genes in response to various hormone treatments. The heatmap has been generated based on the fold change values in the treated sample as compared to its mock-treated control sample. The color scale for fold-change values is shown at the bottom. IAA, auxin; ABA, abscisic acid; ACC, ethylene derivative; SA, salicylic acid; JA, jasmonic acid. (C) Heatmap showing the differential expression of AtGRX genes in response to various abiotic stress treatments. The heatmap has been generated based on the fold change values in the treated sample as compared to its mock-treated control sample. The color scale for fold-change values is shown at the bottom. DS, desiccation; SS, salt; CS, cold; OS, osmotic stress.