Download
1 / 25
400 likes | 1k Views
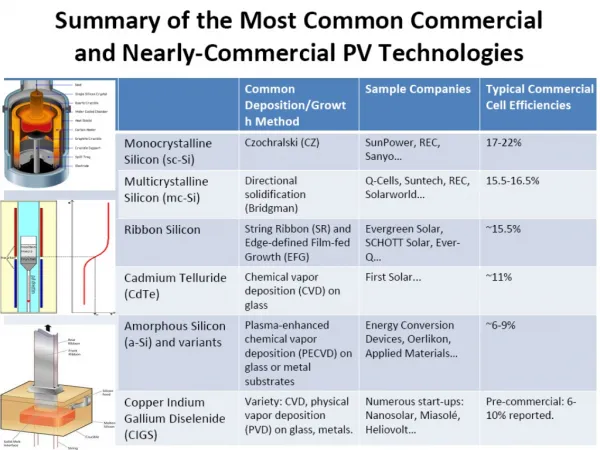
Thin Film PV Transparent Conductive Oxide History, Functions, and Developments. Chris Cording AGC Flat Glass North America. Introduction. Thin-film modules often require a front Transparent Conductive Oxide (TCO) High growth thin-film PV industry requires rapidly growing material supply.

E N D
Thin Film PV Transparent Conductive Oxide History, Functions, and Developments Chris Cording AGC Flat Glass North America
Introduction • Thin-film modules often require a front Transparent Conductive Oxide (TCO) • High growth thin-film PV industry requires rapidly growing material supply. • Textured tin oxide can be produced on a float production line with large volumes and good economies of scale.
History • Early TCO’s were produced off-line • On-line textured SnO2:F TCO for a-Si first produced in late 1993. • Sizes up to 130” x 204” (3.3 x 5.2m) • 10 miles per day in length • Enough for 4.2 MW per day at 8% efficiency • About 410 tons per day of front glass
Fluorine Doped Tin Oxide • Mechanically durable • Easily produced and processed • Heat resistant • Chemically stable • Moisture resistant • Controllable morphology • Lower cost than other TCOs such as ITO • Can resist sodium damage
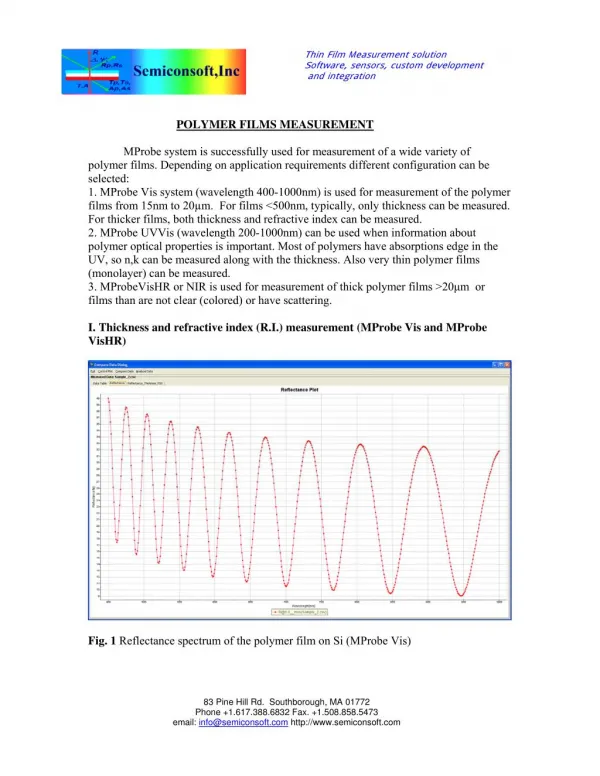
Properties and Functions • Haze (texture) • Light transmission • Conductivity
Haze • Scatters light into the silicon layers • Creates a gradient index of refraction between the tin oxide and silicon. • Imposes texture to the back contact for light scattering. • Increases surface area for electron transport • Increases active area of silicon • Increases surface area for silicon adhesion
Spectrophotometer Integrating Sphere Spectrophotometer Light Source Sphere with open port Light Light that is not scattered Light scattered in the sphere from haze Glass with Hazy TCO
Light Transmission • Desire a low absorption coefficient • Low carrier concentration • High electron mobility • Good morphology required • Can be more accurately measured by reducing haze error by covering with methylene iodide (CH2I2) and a quartz plate • Low iron glass
Conductivity • Measured by a four-point probe • Carrier concentration • Electron mobility • Film thickness • Crystal shape, size, orientation • Can be fixed conductivity or mobility shifting
TCO Adhesion • TCOs can be subject to peeling due to sodium in the glass if the TCO is not properly designed • The best published test is by Energy Photovoltaics (EPV): • K. W. Jansen, Dr. A. E. Delahoy “A Laboratory Technique for the Evaluation of Electrochemical Transparent Conductive Oxide Delamination from Glass Substrates,” Thin Solid Films 423 153 – 160 (2003), Elsevier Science B.V. (2002)
Tempering/Heat Strengthening Modulus of Rupture (M.O.R.) in Flexure 60 Second Duration: Mean M.O.R. (Probability of breakage 50%) 6,000 psi (41 MPa) Annealed 12,000 psi (82 Mpa) Heat Strengthened 24,000 psi (165 Mpa) Tempered Typical Design M.O.R. (Probability of breakage 0.8%) 2,800 psi (19 Mpa) Annealed 5,600 psi (39 Mpa) Heat Strengthened 11,200 psi (77 Mpa) Tempered
Glass a a - - Si Si μ μ c c - - Si Si Glass with TCO Injectors Glass Conveyer Recent Advances in TCOs Objective: Develop optimal TCO For a-Si/mc-Sitandem solar cell AR UC TCO TCO Electrode 裏面電極
a-Si:H mc-Si:H QE by Wavelength M.Vanecek, J.Springer et al. Proceedings of WCPEC-3, p1527,(2003)
t=2.1μm t=1.4μm t=0.76μm Type-U Haze vsλ Normal SnO2:F Haze decreases with increasing wavelength.
1μm Properties of Normal SnO2:F Type-U SEM Images 1μm 1μm Thickness0.76μm1.4μm2.1μm Haze Value 16 % 42% 58% (at 550nm) Transparency 88% 86% 85% (at 550nm) Sheet resistance 8 Ω/sq 5 Ω/sq 4 Ω/sq RMS 45nm 62nm 80nm
Height Distribution Curve t=0.76μm RMS=45nm Type-U t=1.4μm RMS=62nm t=2.1μm RMS=80nm Thicker film has larger height distribution that results in large haze values, but no benefit at wavelengths over 500 nm.
a c d 1μm 1μm 1μm 1μm 1μm 1μm 1μm 1μm Properties of W-Textured Films b Haze Value (at 550nm) 35 % 84% 95% 90% Transparency (at 550nm/at800nm) 89%/88% 89%/88% 88%/88% 89%/88% 10Ω/sq 9 Ω/sq 8 Ω/sq 10 Ω/sq
a c d d 1μm 1μm 1μm c b a Haze for W-Textured Films
a c d Type-U RMS=45nm a) RMS=65nm 1μm 1μm 1μm b) RMS=109nm c) RMS=122nm d) RMS=150nm Surface Distribution of W-Texture
a c d 1μm 1μm 1μm Absorption of W-Texture
d d 1μm QE with W-Texture d Type-U Measured QE increases up to 35%!
Conclusions • W-Texture is being developed in an off-line process. • The cooperative efforts of thin-film PV manufacturers and the glass industry can result in economies of scale and a bright successful future.