Download
1 / 20
200 likes | 203 Views
This paper discusses the measurement of neutrino velocity using the OPERA detector in the CNGS beam. It covers topics such as the OPERA detector, principle of time-of-flight measurement, measurement of neutrino baseline, data selection, neutrino event timing, and data analysis. The study provides precise measurements and concludes with the methodology used.

E N D
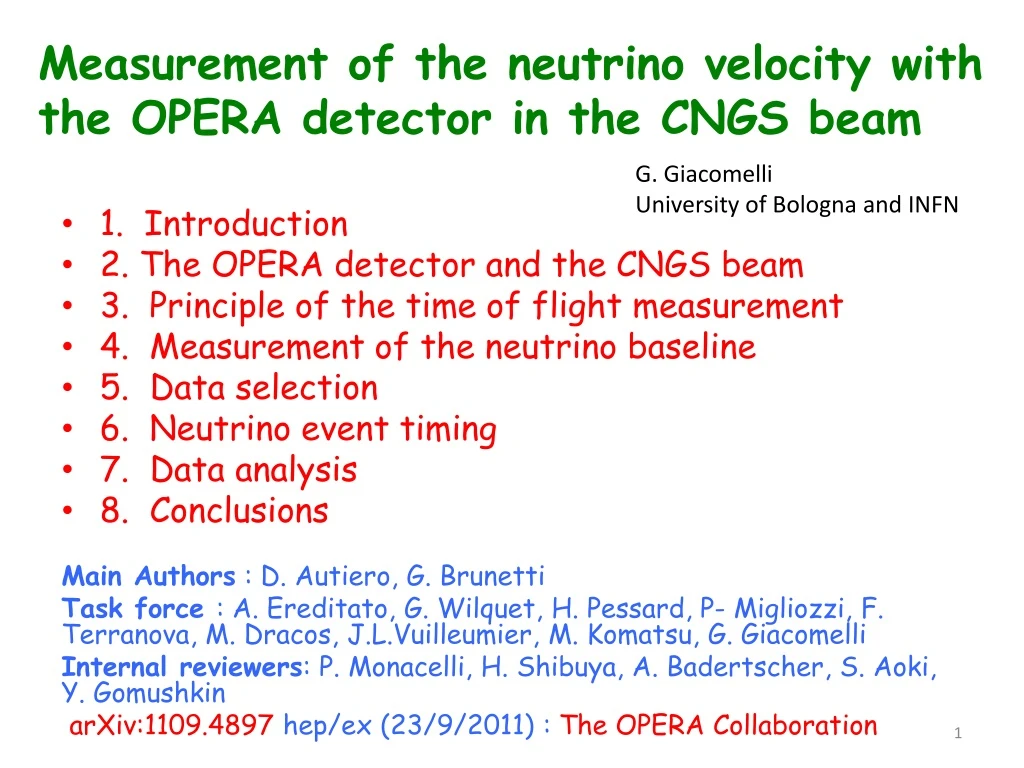
Measurement of the neutrino velocity with the OPERA detector in the CNGS beam G. Giacomelli University of Bologna and INFN • 1. Introduction • 2. The OPERA detector and the CNGS beam • 3. Principle of the time of flight measurement • 4. Measurement of the neutrino baseline • 5. Data selection • 6. Neutrino event timing • 7. Data analysis • 8. Conclusions Main Authors : D. Autiero, G. Brunetti Task force : A. Ereditato, G. Wilquet, H. Pessard, P- Migliozzi, F. Terranova, M. Dracos, J.L.Vuilleumier, M. Komatsu, G. Giacomelli Internal reviewers: P. Monacelli, H. Shibuya, A. Badertscher, S. Aoki, Y. Gomushkin arXiv:1109.4897 hep/ex (23/9/2011) : The OPERA Collaboration
1. INTRODUCTION In the past : • for En> 30 GeV, short baseline: no deviation down to v-c/c =4 10-5 - MINOS : v-c/c=5.1 +-2.9 10-5 • SN1987A : En = 10 MeV : limit v-c/c=2.9 10-9 -Method of measurement of the velocity : vn=l/TOF [+corrections] Precise measurement of the CERN-OPERA distancel by geodesy to 20 cm “ “ TOF via GPS synchronzedatomic clocks+…… 2.1 OPERA The hybrid OPERA detector at LNGS is composed of two identical Super Modules each consisting of an instrumented target section with a mass of 625 t followed by a magnetic muon spectrometer. Each target section is a succession of walls filled with high spatial resolution emulsion/lead units interleaved with pairs of 6.7 × 6.7 m2 planes of 256 horizontal and vertical scintillator strips composing the Target Tracker (TT). The TT allows the localisation of neutrino interactions in the targetand is used to measure the interaction time of neutrinos . 2.2 CNGS Protonsejected from the SPS: 2 extractions, each of 10.5 ms, spacedby 50 ms.
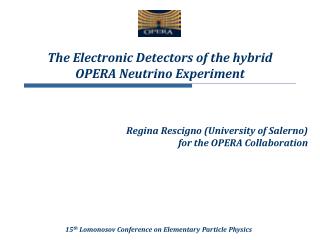
The OPERA hybrid detector Old slide 31 target planes / supermodule (in total: 150000 bricks, 1350 tons) SM1 SM2 Magnetic Spectrometers Targets
Side photograph of OPERA SM1 SM1 SM2 SM2 Target area Muon spectrometer A. Ereditato - CERN - 4 June 2010
Artistic view of the SPS/CNGS layout. 400 GeV protons
3. Neutrino TOF measurement The time of flight of CNGS neutrinos (TOFn) cannot be precisely measured at the single interaction level since any proton in the 10.5 ms extraction time may produce the neutrino detected in OPERA. However, by measuring the time distributions of protons for each extraction for which neutrino interactions are seen in the detector, and summing them together, after proper normalisation one obtains a probability density function (PDF). It is a good prediction of the time distribution of neutrinos that can be compared with the time distribution of their interactions detected in OPERA in order to measure TOFn. The deviation dtfrom the transit time assuming neutrinos travelling at the speed of light is determined by performing a likelihood maximization of the time tags of the OPERA events with respect to the PDF as a function of dt. 400 GeV Protons measured by a Beam Current Transformer (BCT) Full FLUKA based simulation of the CNGS secondary beam. Precise identical GPS receivers and Cs clocks at CERN and LNGS. Intercalibrated by Swiss METAS and permanently time-linked. 4. Measurement of the neutrino baseline Precision measurement of CNGS-OPERA distance: 73053461+-20 cm.
5. Data selection. 6. Neutrino timing Data from 2009+2010+2011 runs: 7586 Internal(CC+NC) +8525 external events In OPERA the time of a ninteraction is that of the earliest hit in TT (checked) The synchronisation of the two timing systems at CERN and OPERA was calibrated by the German Metrology Institute PTB by taking data at CERN and LNGS with a portable time-transfer device. 7. Data analysis • A separate likelihood maximisation procedure was carried out for each extraction. The likelihood function to be maximised for each extraction is a function of the single variable dtto be added to the time tags tjof the OPERA events. These are expressed in the time reference of the proton waveform digitizer assuming neutrinos travelling at the speed of light, such that their distribution best coincide with the corresponding PDF: • the likelihood probability is defined by : Lk(dtk) =Pjwk(tj+dk)
GPS Tflight = 2.44 msec TOPERA = Event TimeStamp TCERN = Time Stamp SPS extraction TOPERA - (TCERN + Tflight) < ∆TGate Time Selection of Beam Events GPS Time Stamp resolution ~100 ns
Monitoring of the PolaRx2e GPS antenna position, showing the slow earth crust drift and the fault displacement of the 2009 earthquake in the LNGS region.
Waveforms of the OPERA neutrino events corresponding to the two SPS extractions for the 2009, 2010 and 2011 data samples.
Results of the likelihood maximization corresponding to the two SPS extractions for the 2009, 2010 and 2011 data . The likelihood maximization procedure was checked with a Monte Carlo simulation.
Wave Form Digitizers Comparison between the data distributions and the PDF for the two SPS extractions before and after applying corrections for dt resulting from the likelihood maximization.
Table 1: Summary of the calibration values assumed in the blind analysis and those corresponding to the final analysis.
Table 2: Contributions to the overall systematic uncertainty on the measurement of dt.
The left plot shows the energy dependence of nmCC internal events (for En<20 Gev and En>20 GeV). The errors attributed to the two points are statistical in order to make easier their relative comparison since systematic errors cancel out; the systematic error is represented by a band around the zero effect line. The right plot shows the global result of the analysis including both internal and external events (for the latter the energy cannot be measured). The error bar includes statistical and systematic uncertainties added in quadrature.
8. Conclusions dt= (60.7 ± 6.9 (stat.) ± 7.4 (sys.)) ns at <En>=17 GeV • significance 6.0 s (stat + sysadded in quadrature) • (v-c)/c = dt/(TOFc- dt) = (2.48 ± 0.28 (stat.) ± 0.30 (sys.)) ×10-5 • No energy dependencein our range of energies “Despite the large significance of the measurement reported here and the stability of the analysis, the potentially great impact of the result motivates the continuation of our studies in order to investigate possible still unknown systematic effects that could explain the observed anomaly. We deliberately do not attempt any theoretical or phenomenological interpretation of the results.”