Download

1 / 78
840 likes | 1.15k Views
MRI Orbit. For Postgraduates Professor/ Ahmad Mostafa. Introduction.

E N D
MRI Orbit For Postgraduates Professor/ Ahmad Mostafa
Introduction • Magnetic resonance (MR) images are obtained by placing a patient within a strong and highly uniform static magnetic field. The tissue being examined contains numerous hydrogen atoms consisting of one proton, neutron, and electron. The hydrogen atoms behave like small dipole magnets within the magnetic field and become aligned with the magnetic field. Radiofrequency (RF) waves tuned to the Larmor frequency of hydrogen are then applied to the tissue, and these nuclei absorb a portion of the RF energy to enter a state of excitation. The RF pulse is then turned off, allowing the hydrogen nuclei to return to their normal state of equilibrium by giving up energy to the environment (relaxation). The rate, degree, direction, and pattern of resonant energy emission by the relaxing protons can be localized, quantitated, and transformed into diagnostic images.5 Unlike CT images, which are based on differential radiographic absorption, MR images depend on the proton density (hydrogen ion content) and proton relaxation dynamics that are representative of the tissue's physical and chemical properties.5,6
MRI can provide anatomically detailed images of the orbit that are comparable and, in many cases, superior to high-resolution CT scans. Recent technical developments, including orbital surface coils, fat suppression techniques, fast gradient-echo pulse sequences, and MR contrast agents, allow this noninvasive modality to provide excellent spatial and contrast resolution of the orbital soft tissues with direct multiplanar imaging.7–9 In addition, MR spectroscopy, used to evaluate tissue metabolic dynamics at a biochemical level, has tremendous potential in the study of orbital diseases and their response to treatment.5,10
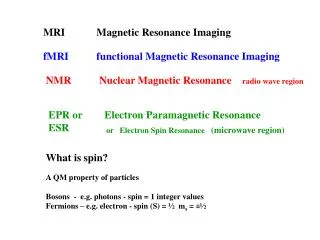
PHYSICAL PRINCIPLES OF MRI (1) FUNDAMENTAL PRINCIPLES • The nucleus of an atom contains protons (positive charge) and neutrons (no charge), and each of these elementary particles spins on its own axis. Because of a relationship between electricity and magnetism, the electric charge and spin of these particles produce a small local nuclear magnetic field. In nuclei with an even mass number (an even number of protons and neutrons), the spinning particles are paired and their magnetic properties cancel. However, in nuclei with an odd mass number, such as hydrogen, sodium, and phosphorus, these spinning particles produce a net magnetic moment. Such nuclei behave as magnetic dipoles and respond to external magnetic fields (Fig. 1).
Fig. 1. A hydrogen atom contains a proton that spins on its own axis and an electron in orbit around the nucleus. The rotating nucleus behaves as a magnetic dipole, similar to the bar magnet illustrated on the left. The magnetic moment of the nucleus, denoted by the arrows, is determined by the sum of its magnetic forces.
Hydrogen, which contains a single proton, has the largest magnetic moment of all stable atomic nuclei and is highly prevalent throughout biologic tissues. For these reasons, hydrogen forms the basis for MRI and exemplifies its principles. In nature, the magnetic moments of the hydrogen nuclei in biologic tissues are randomly oriented and therefore exhibit no net magnetic effect (Fig. 2). When these nuclei are placed in a strong static magnetic field, such as that produced in an MRI unit, they line up parallel or antiparallel to the field. Slightly more align parallel to the main magnetic field, because this is a lower energy state, and produce a net magnetic vector in this direction (Fig. 3).
Fig. 2. The magnetic moments of hydrogen nuclei are randomly oriented in nature.
Fig. 3. A net magnetic vector is produced by the nuclei that align parallel to a strong stane magnetic field.
(2) RADIOFREQUENCY WAVES When a properly tuned pulse of RF energy is applied to the tissues in the static magnetic field, the nuclei absorb energy and can shift from parallel to antiparallel alignment (Fig. 4). The energized nuclei are said to “resonate” as they flip to a higher energy state. The duration and amplitude of the RF pulse determine the degree of change of the magnetic moment of each nucleus and the direction of the net magnetic vector. When the RF pulse is turned off, the nuclei “relax” and return to the equilibrium state with the net magnetic vector again parallel in alignment to the direction of the static magnetic field (Fig. 5). The energy released as the nuclei realign at the lower energy state is received as an RF signal by a receiver RF coil, and this signal is processed by a computer to generate an image. When a properly tuned pulse of RF energy is applied to the tissues in the static magnetic field, the nuclei absorb energy and can shift from parallel to antiparallel alignment (Fig. 4). The energized nuclei are said to “resonate” as they flip to a higher energy state. The duration and amplitude of the RF pulse determine the degree of change of the magnetic moment of each nucleus and the direction of the net magnetic vector. When the RF pulse is turned off, the nuclei “relax” and return to the equilibrium state with the net magnetic vector again parallel in alignment to the direction of the static magnetic field (Fig. 5). The energy released as the nuclei realign at the lower energy state is received as an RF signal by a receiver RF coil, and this signal is processed by a computer to generate an image.
Fig. 4. A radiofrequency (RF) wave applied perpendicular to the static magnetic field is depicted by the undulating arrow directed downward. This RF energy is absorbed by the nuclei, causine them to till out of parallel alignment to an antiparallel orientation and to “resonate” at a higher energy level.
Fig. 5. When the radiofrequency (RF) wave is turned off, the excited nuclei realign parallel to the static magnetic field. The excess energy released as the nuclei “relax” to a lower energy stare is emitted as an RF signal.
(3) GRADIENT COILS • The spatial encoding information required for imaging the MR signal is achieved by use of gradient coils. These coils surround the patient's body in the MRI unit and select the plane (axial, coronal, sagittal, or oblique) to be studied (Fig. 6). A gradient magnetic field is applied by these coils perpendicular to the specified tissue section and isolates the desired plane's RF signal. These signals are further localized by additional manipulation of the magnetic fields parallel to the tissue section into multiple-volume units called voxels(Fig. 7). Each voxel represents a group of hydrogen nuclei with a unique sum of frequencies and phases. A computer reconstructs the signals from these individual three-dimensional voxels into corresponding pixels that compose the two-dimensional image of that plane. The intensity, or whiteness, of each pixel is proportional to the strength of the RF energy obtained from the corresponding voxel.
Fig. 6. X, Y, and Z gradient coils surround the area being studied and correspond to the planes chosen to be imaged.
Fig. 7. A thin slice of the area to be studied is divided evenly into multiple 3D voxels. The distinct radiofrequency signal emitted from these voxels determines the intensity of the corresponding pixels, which compose the total image of the slice.
(4) SPATIAL RESOLUTION • Spatial resolution in MRI refers to the discrimination between two points in the image and is dependent on the number and size of pixels; thus, a larger number of smaller pixels in a given field of view yields better spatial resolution. For examinations of the orbits that involve a relatively small area, the field of view can be diminished, thereby reducing the pixel size and improving spatial detail. A reduction of the slice thickness of the plane under study (represented by voxel volume) also improves anatomic delineation by limiting partial volume effects. However, a decrease in the field of view, pixel size, or slice thickness may also adversely affect image quality by causing a concomitant reduction in the signal-to-noise ratio (SNR). Therefore, a compromise of the appropriate parameters must be chosen by the MRI operator to achieve the best image quality for a particular area to be studied.
(5) CONTRAST RESOLUTION • To distinguish between different anatomic structures as well as pathologic processes, disparate tissues must differ sufficiently in contrast. • Contrast resolution is defined as the relative signal difference between two adjoining anatomic structures. Inherent properties of different tissues make MRI a powerful tool because their individual rates of relaxation in a magnetic field result in excellent contrast resolution on MR images. • The intrinsic biologic properties that are used as parameters for imaging include the T1 relaxation time constant, the T2 relaxation time constant, the concentration of hydrogen (proton density), and the rate of flow of moving fluids in tissues. • Extrinsic parameters used by the MRI operator to further improve tissue contrast include pulse sequences, contrast agents, and fat suppression techniques. Each of these parameters is discussed hereafter.
(A) Intrinsic Factors i. T1 RELAXATION TIME Tl relaxation time is the time required for the energized nuclei to give up the excess energy that was acquired from the RF pulse (high-energy state) and re-establish equilibrium (low-energy state) with the main magnetic field. The excess energy is released by these excited nuclei to the surrounding molecular environment, or lattice, and results in T1 relaxation, also called spin-lattice relaxation time. In different biologic tissues, hydrogen has a Tl ranging from a few hundred milliseconds to a couple of seconds. This range exists because local tissue factors affect the ability of specific protons to give up energy to the surrounding tissues. For example, hydrogen atoms attached to the carbon atoms of fat molecules relax much more rapidly than those attached to the oxygen atoms of water molecules. Viscosity, concentration, temperature, and molecular environment of the hydrogen atoms in the tissues also affect the T1 relaxation time. On a T1-weighted orbital image, fat, which has a very short T1 relaxation time, yields a high-intensity signal; the rectus muscles, which have an intermediate T1, yield an intermediate-intensity signal; and the vitreous, which has a long T1, yields a low-intensity signal(Fig. 8)
Fig. 8. T1-weighted image shows the excellent contrast resolution of the soft tissues of the orbit. Note the contrast between the high-intensity (bright) signal of orbital fat and intermediate signal of the extraocular muscles and optic nerves. The lens, vitreous, and sclera can also be easily distinguished. The air in the ethmoidal sinuses emits no signal and therefore appears dark (arrow-head). The left lateral orbital wall also appears dark because of the low proton density and free-water content of cortical bone (short arrows). The bone marrow in the right orbital rim is depicted by a bright signal as a result of its fat contents (long arrow).
ii. T2 RELAXATION TIME. • Application of a 90° RF pulse brings the excited nuclei into phase so that the net vector of their magnetic moments is directed perpendicular to the static magnetic field. Shortly thereafter, the magnetic moments of the nuclei spread out and point in different directions, leading to a loss of phase coherence and a resultant decay in signal intensity amplitude. The T2, or spin-spin relaxation time, is the rate of decrease in the signal of these excited nuclei as a result of the interaction and transfer of energy to unexcited adjacent nuclei. T2 ranges from a few milliseconds to a few hundred milliseconds and, for a given tissue, is always less than the Tl relaxation time. T2-weighted orbital images are easily recognized by a high-intensity signal from the vitreous (Fig. 9).
Fig. 9. T2-weighted image of the orbits does not delineate normal anatomic details well. The lens can be visualized in the bright vitreous.
iii.Proton Density • If enough time is allotted between RF excitations, all of the protons eventually relax and the signal is no longer primarily dependent on the previously mentioned time constants. Images obtained with these parameters are called proton density weighted. These images usually show less contrast resolution than T1- and T2-weighted images because the difference in hydrogen concentration (proton density) of soft tissues is relatively small.
iv. FLOW OF PROTONS • Blood vessels with rapidly flowing blood usually appear as regions of low intensity in contrast to the surrounding tissues. This phenomenon is explained by the fact that excited protons in the blood within the imaging slice that received the RF pulse pass outside the slice before their signal is detected by the RF receiver coils (Fig. 10). By the time the slice is imaged, the replacement blood, which has not received the RF energy stimulus, does not yield a signal, and consequently the blood vessel appears dark.
Fig. 10. The lumina of blood vessels containing rapidly flowing blood appear dark because the excited protons in the blood leave the imaging slice before the emitted signal can be detected. This phenomenon is illustrated by dividing a blood vessel into three frames. The nucleus in the central frame energized by the radiofrequency (RF) signal passes out of the imaging plane into the right frame before it relaxes and emits a signal. In the left frame, the hydrogen nucleus is not exposed to the RF waves and therefore cannot give a signal as it enters the imaging plane in the central frame. Therefore, no signal is detected in the blood vessel, which consequently appears dark
(B) Extrinsic Factors • PULSE SEQUENCES Varying the amplitude, power, and timing of successive RF pulses can alter MRI soft tissue contrast. This technique, known as pulse sequencing, allows the MRI operator to selectively weight the signal contributions of disparate tissues to enhance image contrast. Numerous pulse sequences as well as innumerable variations have been developed by MRI vendors to optimize visualization of different orbital tissues, each of which has different strengths and limitations. Some of the major types of pulse sequences include saturation recovery (SR), also known as partial saturation; inversion recovery (IR); and conventional spin echo (SE), fast spin echo (FSE), and gradient echo (GE). SR images are primarily weighted for Tl and proton density and produce detailed images of normal anatomy. The IR pulse sequence is a T1-weighted sequence that provides excellent contrast resolution but requires a longer imaging time. The conventional SE technique can be used to obtain high quality T1-, T2-, or proton density–weighted orbital scans. This pulse sequence, however, requires relatively long imaging times and has almost been completely replaced by the FSE pulse sequence. The latter can provide similar types of contrast weighting as SE at about one-fourth the imaging time. It is the most common pulse sequence currently used to evaluate pathologic conditions of the orbit. FSE scans utilize a similar TR interval but acquire a “train” of eight to 16 echoes from each excitation.
T1-weighted scans are generated from the early group of echoes and T-2-weighted scans from the later group of echoes. FSE images can be weighted toward Tl, T2, or proton density, depending on the selected time parameters. The repetition time (TR), which is the time interval between subsequent RF pulses, and echo delay (TE), which is the time interval between the RF excitation and detection of the signal emitted from relaxing protons, are time parameters that can be altered in any pulse sequence to accentuate differences in the intrinsic responses of tissues being imaged. Gradient-echo pulse sequences are especially useful for rapidly obtaining images of the orbit. Normally, a spin-echo image is generated using at least two RF pulses: a 90° excitation pulse and a refocusing 180° pulse. The latter is used to produce the echo which, in turn, is used to form the image. Alternatively, an echo can be formed by the application of a transient magnetic field gradient after the 90° pulse. Gradient echoes can be produced much more rapidly but are more susceptible to artifacts. Fast, fairly high-quality orbital images that are T1-, T2-, or proton density weighted can be obtained using gradient echoes and RF pulses that are shorter (5° to 60°) in duration than the typical 90° pulses used in SE imaging. These pulse sequences bear different names depending on the specific MRI vendor and specific pulse sequence parameters (GRASS, SPGR, FLASH, FISP, MPGR, etc.).
ii. CONTRAST AGENTS • Contrast agents composed of paramagnetic or superparamagnetic materials can alter tissue properties to improve the MRI detection and characterization of certain pathologic lesions. Gadolinium diethylenetriaminepentaacetic acid (Gd-DTPA), the only paramagnetic agent currently approved in the United States for clinical applications, shortens the relaxation times of adjacent protons (hydrogen nuclei) and results in a bright signal on T1-weighted images. Gadolinium, like most heavy metals, is toxic in its nonchelated form but is safe when strongly bound to DTPA, which serves to eliminate its biologic toxicity. It is administered intravenously and is generally considered safer than iodinated radiographic contrast materials used for CT scans and arteriograms. It has little immunologic, systemic, and renal toxicity.20 Gd-DTPA has been shown to effectively detect disruption of the blood–brain barrier and delineate orbital tumors, such as meningiomas, gliomas, hemangiomas, and metastases (see Lacrimal Gland Tumors and Inflammatory and Lymphoproliferative Lesions in the section on Orbital Diseases). It also appears promising in identifying areas of altered circulation due to inflammation, ischemia, soft tissue injury, and neoplasia.
iii. FAT SUPPRESSION TECHNIQUES • MR images are produced by signals arising primarily from protons attached to either lipids or water. The protons from water and lipid resonate at slightly different frequencies. Spatial encoding of the x and y coordinates of the MR image from a given pulse sequence requires both phase and frequency information to properly map the signal information to its respective pixel. A well-known phenomenon, chemical shift artifact, is produced when water and fat protons lie in close proximity to each other. Because of the slight difference in the resonate frequencies of the adjacent fat and water protons, they are spatially mismapped in the frequency-encoded direction of the MR image, producing a dark artifactual band on one side of the interface and a bright band on the other side. This results in loss of anatomic detail in MR images of body parts, such as the orbit, that contain both lipid and water. Numerous techniques have been devised to suppress fat signals and improve visualization of lesions that develop in areas of high fat content, such as the orbit (see Intraocular Tumors, below). Three basic methods are in current use: T1-adependent suppression (e.g., short inversion time inversion recovery [STIR]), frequency-selective methods (e.g.,chemical shift selective imaging [CHESS]), and phase-dependent methods (e.g., Dixon, Chopper methods)
iv. MAGNETIC RESONANCE ANGIOGRAPHY AND VENOGRAPHY • The MR angiography (MRA) technique uses fast gradient-echo scans to provide a noninvasive alternative for evaluating the carotid bifurcations and intracranial vessels. The time-of-flight MRA sequence is most commonly used and consists of a series of very thin, flow-sensitized, two-dimensional images that are acquired and subsequently reconstructed into a three-dimensional data set. The three-dimensional data can be rotated into any imaging plane by the computer software, providing images in multiple angiographic projections. MRA has recently become a fixture for noninvasive vascular imaging of the brain, face, and orbit. Advancements in spatial resolution and reduction in examination time has led to routine use of MRA for initial evaluation of vascular abnormalities such as aneurysms, arteriovenous malformations, and vascular tumors.25–27 The spatial resolution, however, remains inferior to that of conventional angiography. Angiography is still required for detection of aneurysms less than 2 to 3 mm since these are not reliably detected by MRA. Magnetic resonance venography (MRV) is considered the study of choice for evaluation of cerebrovascular veno-occlusive diseases, such as dural venous or cavernous sinus thrombosis.
PATIENT PREPARATION • Before MRI is performed, patients must be screened and prepared to avoid the potential hazards associated with the strong magnetic field. Patients who have ferrous aneurysm clips or cardiac pacemakers, who depend on life-support equipment, or who retain a possible metallic intraocular foreign body are not candidates for this imaging modality. MRI cannot be performed on obese patients who cannot fit into the bore of the magnet. Patients who are claustrophobic may not tolerate a prolonged period of study within the confines of the magnet, whereas others might do well if given a mild sedative. All worn metallic objects (e.g., necklaces, watches) should be taken off, credit cards set aside, and eye makeup removed before entering the room containing the magnet.5,20,34,35,36
NORMAL ORBITAL ANATOMY • T1-weighted images provide the best anatomic details of the orbit because they display superior contrast resolution between normal structures (see Fig. 8). The vitreous has a long T1, resulting in an intermediate signal similar to brain, whereas the crystalline lens and sclera appear dark because of a longer T1 and short T2. The extraocular muscles, like all skeletal muscles, demonstrate a moderately long T1 and short T2 and highly contrast with the intense signal of the surrounding orbital fat (adipose tissue has an extremely short T1). The lacrimal glands appear as mottled areas of reduced intensity of the signal from the orbital fat in the lacrimal fossa. The optic nerves are seen with the same signal intensity as brain white matter and are hypointense relative to the orbital fat because their Tl is longer than the Tl of fat but shorter than the Tl of water.
Cortical bone is not well delineated because it contains little free water, yielding minimal signal in MRI, and thus appears dark on all pulse sequences. This feature explains why MR images of the orbital apex and intracanalicular portion of the optic nerves are superior to comparable CT scans. Partial volume averaging of the bones in these regions obscures soft tissue details on CT images, whereas MRI reveals the signals only from the soft tissue structures with no cortical bone input. Bone marrow, on the other hand, is seen as a relatively intense signal because of its high fat content (see Fig. 8).37,38 • T2-weighted pulse sequences are not ideal for imaging normal anatomy; however, they are particularly useful in revealing pathologic conditions (see Fig. 9). T2-weighted studies are most easily recognized by a bright vitreous signal.
Vascular LesionsCavernous hemangiomas • Cavernous hemangiomas appear as well-circumscribed, smooth, usually intraconal masses that are isointense to muscle on T1-weighted images and hyperintense on T2-weighted images (Fig. 12). Patchy early enhancement is typically followed by diffuse, more homogeneous enhancement.39 The internal architecture of the mass, including septation and internal vasculature, may often be appreciated with high-quality orbital imaging.40
Fig. 12. A. T1- and (B) T2-weighted MR scans demonstrate a well-circumscribed intraconal mass causing severe optic nerve displacement. These lesions are usually intermediate in signal intensity on T1-weighted scans and very hyperintense on T2-weighted Images. C and D. Postcontrast fat-suppressed T1-weighted scans demonstrate characteristic patchy intense enhancement that becomes more complete from the initial postcontrast scan (C) to a more delayed
Lymphangiomas • Lymphangiomas consist of ectatic vascular channels within a connective tissue stoma with varying degrees of lymphoid cellularity. On MRI, these tumors are typically poorly circumscribed, multicompartmental, and heterogeneous, often showing cystic dilations with fluid levels (Fig. 13). The signal characteristics within lymphangiomas vary considerably, reflecting cystic and solid components and the varying paramagnetic characteristics of blood at different stages of degradation.40–42 Acute hemorrhage appears hypointense on both T1- and T2-weighted formats. Methemoglobin present in subacute hemorrhage (3 to 14 days) leads to hyperintense signal on both T1- and T2-weighted images.41 A small percentage of lymphangiomas appear radiologically indistinct from orbital cavernous hemangiomas.43
Fig. 13. A. T1- and (B) T2-weighted MR scans demonstrate a moderately well-circumscribed intraconal mass enveloping the optic nerve. The lesion is hyperintense to vitreous on the T1-weighted scan. A fluid-fluid level (arrow) and patchy hypointense areas are seen within the mass on T2-weighted scan due to the presence of subacute blood products. C and D. Postcontrast fat-suppressed T1-weighted scans demonstrate no significant enhancement within the lesion, although there is minimal peripheral enhancement in surrounding orbital tissues.
Orbital varices • Orbital varices are venous malformations that expand with increased systemic venous pressure, such as with Valsalva maneuvers. Because rapid acquisition of images during a Valsalva maneuver is important in imaging such a lesion, conventional or spiral CT is currently the modality of choice.44
MRI is an excellent modality for demonstrating enlargement of the cavernous sinus and dilation of the superior ophthalmic vein in patients with high-flow carotid-cavernous fistulas (Fig. 14).37MRA may be helpful in the evaluation of the venous outflow pattern. The rapidly flowing blood in these vascular structures carries the excited protons out of the section before they can be imaged, resulting in their dark appearance.5 In low-flow dural arteriovenous malformations, MRA may help define the arterial feeding vessels.45
Fig. 14. Patient with Ehlers-Danlos syndrome who presented with abrupt onset of severe proptosis. A-C. Postcontrast fat-suppressed T1-weighted MR scans demonstrate marked proptosis and engorgement of the extraocular muscles and superior ophthalmic vein (arrows). D. T2-weighted scan through the cavernous sinus demonstrates enlargement and arterialized flow void within the right cavernous sinus (open arrow).
Neural Lesions • MRI is more effective than CT in delineating the intracranial optic nerves, chiasm, and optic tracts and, for this reason, is the preferred imaging modality in the evaluation of optic nerve disorders. The spatial relationships and image contrast of the orbital tissues with intraorbital optic nerve tumors is comparable between the two imaging modalities. The normal nerve is isointense to brain and appears enlarged and kinked owing to infiltration of an optic nerve glioma on T1-weighted images. Gliomas appear hyperintense on T2-weighted images and may be heterogeneous owing to cystic areas within the tumor. Contrast enhancement is variable.46
Intraorbital and intracranial optic nerve sheath meningiomas are usually isointense to cortical gray matter on Tl-weighted images and remain isointense on proton density studies (Fig. 15). Gd-DTPA is useful in delineating the intracranial extension of optic nerve meningiomas.7,47 The hyperostosis of bone and calcification associated with meningiomas are not demonstrated as well on MRI studies as on CT scans.20,37 Gd-DTPA–enhanced MRI also appears promising in the study of the permeability of the blood–brain barrier in selected optic neuropathies.22,48 MRI may reveal an enlarged optic nerve and some degree of contrast enhancement in cases of optic neuritis.49
Fig. 15. A. T1- and (B) T2-weighted MR scans demonstrate a mass causing fusiform enlargement of the optic nerve sheath complex. The peripheral portion of the mass, representing the meningioma, is isointense to brain on the T1-weighted scan and notably hypointense on the T2-weighted scan. The central portion of the mass, representing an edematous optic nerve, is very hyperintense on the T2-weighted scan (arrow), C and D. Postcontra fat-suppressed T1-weighted scans demonstrate intense peripheral enhancement of the meningioma surrounding the central nonenhancing optic nerve (arrow). Also note the enhancing Intracranial “dural tail” (double arrow).
Muscle Disorders • Extraocular muscle enlargement in patients with thyroid-associated orbitopathy is demonstrated equally well with CT and MRI studies. However, the superior tissue contrast on MR images reveals better details of the relationships of the optic nerve to the thickened muscles at the orbital apex (Fig. 16).50 In addition, MRI may be able to differentiate between muscles that are enlarged as a result of edema and active inflammation and those enlarged because of fibrosis by their T2 relaxation times.21 Quantitative MRI was not found to be accurate in predicting the success of low-dose orbital irradiation.51 However, a muscular index relating the diameters of the rectus muscles to the bony orbital dimensions was useful in predicting optic nerve compression.52
Fig. 16. A-C, T1-weighted MR scans obtained with a high-resolution surface coil demonstrate fusiform enlargement of the extraocular muscles. The medial, lateral, and inferior rectus muscles are especially involved. Note the relative sparing of the tendinous insertions, a finding characteristic of this disease process, as well as fatty infiltration of the lateral and inferior rectus muscles. There is marked proptosis, best visualized on the sagittal image (A), and mild crowding of the optic nerve at the orbital apex.
MRI is also effective in imaging orbital tumors of mesenchymal origin, such as rhabdomyosarcoma, particularly in the assessment of extension into the anterior and middle cranial fossae (Fig. 17).37 The lack of any pathognomonic radiologic features necessitates rapid orbital biopsy when rhabdomyosarcoma is suspected.
Fig. 17. A. T1- and (B) T2-weighted MR scans demonstrate a preseptal and extraconal mass displacing the globe medially. The mass is slightly hyperintense on the T1-weighted scan and very hyperintense on the T2-weighted scan owing to the high extracellular water content of the neoplasm. The lesion abuts the globe and appears to infiltrate the lateral rectus muscle (arrow). C and D. Postcontrast fat-suppressed T1-weighted scans demonstrate intense enhancement of the highly infiltrative lesion that is invading the lateral rectus, superior rectus, and levator palpebrac superioris muscle (double arrows).
Osseous Lesions • In general, CT is the imaging modality of choice when details of quantity and quality of bone are needed; however, abnormalities of bones can be detected indirectly by MRI. Cortical bone appears black (signal void) on MR images because of its low proton density and free-water content. The absence or discontinuity of the signal void of the orbital walls may represent bony destruction or fracture. Hyperostosis associated with prostate metastases or meningioma is visualized as areas of black smudging.50,53 Diseases in which the bone is replaced by pathologic tissues with a high free-water content, such as fibrous dysplasia, are well demonstrated on MRI. An intermediate signal intensity on T1-weighted images and hypointense signal on T2-weighted images is representative of fibrous dysplasia. Enhancement on post–Gd-DTPA MR scans is seen and is more evident in areas that are less mineralized.54
Cystic Lesions • Dermoid cysts appear as rounded, well-defined lesions typically contiguous with an orbital bony suture. The high-intensity signal on T1-weighted images is attributed to the sebaceous-produced lipid contents (Fig. 18).31,50 Mucoceles may demonstrate a hypointense or hyperintense signal on MR images, depending on the concentration of proteinaceous or inflammatory fluid components. The integrity of the bony walls of the expanded sinus cavities cannot be assessed on MR as well as by CT.37,50,55,56 A high-signal intensity on Tl- and T2-weighted images is characteristic of orbital chronic hematic cysts because of the blood-breakdown products within the cysts.57