Download
1 / 10
100 likes | 178 Views
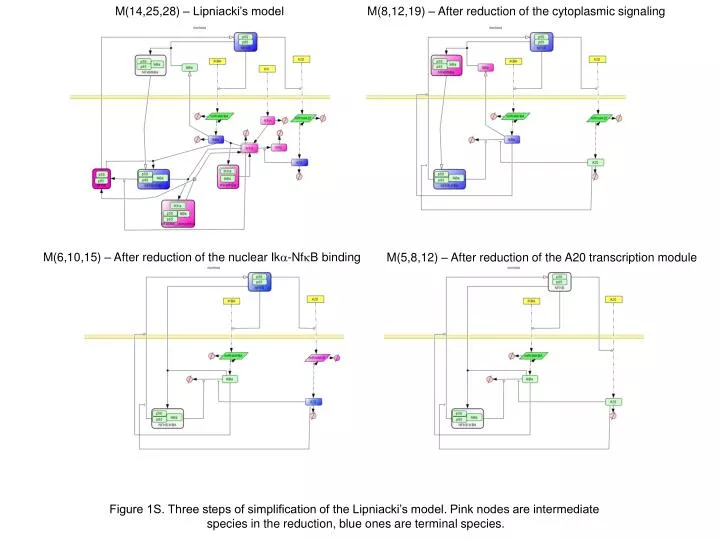
M(14,25,28) – Lipniacki’s model. M(8,12,19) – After reduction of the cytoplasmic signaling. M(6,10,15) – After reduction of the nuclear Ik a -Nf k B binding. M(5,8,12) – After reduction of the A20 transcription module.

E N D
M(14,25,28) – Lipniacki’s model M(8,12,19) – After reduction of the cytoplasmic signaling M(6,10,15) – After reduction of the nuclear Ika-NfkB binding M(5,8,12) – After reduction of the A20 transcription module Figure 1S. Three steps of simplification of the Lipniacki’s model. Pink nodes are intermediate species in the reduction, blue ones are terminal species.
M(39,65,90) Figure 2S1. Structure of the most complex model M(39,65,90) for NfkB signalling
M(34,60,82) Figure 2S2. Structure of the model for NfkB signalling after reduction of the p65 transcription module
M(24,45,62) Figure 2S3. Structure of the model for NfkB signalling after reduction of the p50 transcription module
M(16,34,46) Figure 2S4. Structure of the model for NfkB signalling after reduction of the IkBa transcription module
M(14,30,41) Figure 2S5. Structure of the model for NfkB signalling after reduction of the p50-p65 binding
M(14,25,33) Figure 2S6. Structure of the model for NfkB signalling after introduction of the NfkB conservation law
M(14,25,29) Figure 2S7. Structure of the model for NfkB signalling after simplifying the IkBa production rate
Figure 3S1. Estimating number of non-linear reactions that function in the true ‘non-linear’ (not pseudo-monomolecular) mode. The most complex model M(39,65,90) formally contains 17 non-linear reactions (complex bindings, catalyses). However, only in 4 of them the reactants have comparable concentration levels in some periods of time. These reactions are listed at top. The time periods of ‘non-linearity’ (when reaction reactants have comparable concentrations) are marked by rectangles of the color corresponding to the reaction.
Figure 3S2. Another view on the truly non-linear reaction modes. For 17 non-monomolecular reactions of the most complex model M(39,65,90), ratios of reactants concentrations are shown. One can define truly non-linear periods for the reaction if its reactant ratio is in the [0.1,10] interval. Otherwise, the reactant concentrations are separated by more than one order of magnitude and the reaction rate can be approximated by a pseudo-monomolecular one.