Download
1 / 30
300 likes | 474 Views
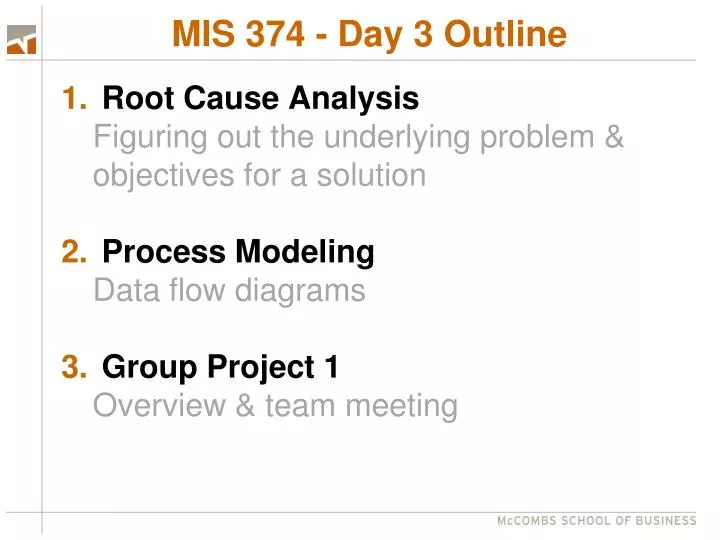
:. Root Cause Analysis Figuring out the underlying problem & objectives for a solution Process Modeling Data flow diagrams Group Project 1 Overview & team meeting. MIS 374 - Day 3 Outline. Root Cause Analysis. A series of symptoms, one causing the next, can lead to the root cause .

E N D
: Root Cause Analysis Figuring out the underlying problem & objectives for a solution Process Modeling Data flow diagrams Group Project 1 Overview & team meeting MIS 374 - Day 3 Outline
Root Cause Analysis A series of symptoms, one causing the next, can lead to the root cause. Why? To come to an early agreement on the scope of the project.
Root Cause Analysis Symptom 1 Declining profits Why? Symptom 2 Total expenses up Why? Symptom 3 Travel expenses up Why? Symptom 4 or Problem or root cause? Sales Territory Assignment Digging Down Through Layers of Symptoms
Solution/Definition for Root Cause Group Project #1 Symptom(s) Cause(s) Solutions Definition effort Objective(s) Performance criteria Solution effort External constraints Internal constraints System
Advanced System Technology Associates (ASTA) • Provides consulting and software for factory automation • Mainly engineers with a broad spectrum of technical expertise relating to their diverse factory automation systems that they manufacture and market around the world • Offices in Austin and Dallas • Project request -- to automate their paper-based “Skill Set system” • They wanted to be able to quickly identify employees possessing the required knowledge and skills demanded by business opportunities as they emerged. • Like most industrial marketing organizations, they respond to requests for proposals (RFPs) submitted by other firms. To be competitive, they need to respond quickly with proposals that showed their relevant expertise and experience. • The MIS 374 team interviewed key stakeholders the first week into the project: three project managers in different company areas and Yolanda Garza, the HR director who actually managed the manila folders that was the data storage of the firm’s “Skill Set system.”
ASTA Root Cause Analysis • From their early interviews, the team reported their results • Their recommendation was to create an automated Skill Set system and two other recommendations • One was a Market Intelligence system to provide information for project managers about market trends and competitor activities to improve ASTA's ability to predict demand. • Another was a warning to upper management that some ASTA employees seldom updated their skill set folders. • Even if the team created an easy-to-use, web-based Skill Set system the firm may need to create incentives or clearer rules about employees keeping their files updated.
ASTA • Symptoms are user-oriented—something a user would complain about or an opportunity a user would respond to • “Points of pain”
ASTA For eachobjective have at least 1 performance criteria Should you address this HR issue ?
Modeling System Processes & Data Process model:Graphically illustrates the movement of data between environmental entities, the processes, and data stores within a system. Scott Ambler, Agile Modeling web site
Data Flow Symbols Environmental entity or External entity -the originator of data or receiver of information outside automation boundary Process bubble - a process step that transforms data Data flow arrow - data and information passing between environmental entities, processes, and data stores Data store - a place to keep data for later reference (can be a data file, file cabinet, note pad, etc.)
The 4 Symbols - illustrated Environmental Entity Process Bubbles Data Store (D1) Data Stores (D2 & 3) Data flow arrows Data Store (D4) Scott Ambler, Agile Modeling web site
Visio Software Design Shapes Exercise 4 & Group Project 1
Resources page – Stencil package DFD Stencil Sentence-by-sentence examples
Visio Software Sources • VISIO is on McCombs Lab PCs • You can download VISIO from Dreamspark– email from Clint with logon info
Data Flow Diagramming Rules Basic rules that apply to all DFDs Inputs to a process are always different than outputs. Objects always have a unique name. To keep the diagram uncluttered, you may repeat EEs and data stores on a diagram “Forms” enter Process 1.“Validated Forms” flow to Process 2.0
Data Flow Process Rules Process No process can have only outputs A miracle No process can have only inputs A black hole Process label has very-object name
Data Flow Data Storage Rules Data Storage Data cannot be moved directly from one store to another Data cannot move directly from an environmental entity to a data store A data store has a noun phrase label x x
Data Flow Diagramming Rules Data Flow A data flow has only one direction of flow between symbols A fork means that exactly the same data goes from a common location to two or more processes, data stores
Context Diagram Special case of the dataflow diagram, in which a single circle represents the entire system The context diagram is composed of 3 elements: Environmental entity …the originator of data or receiver of information outside automation boundary System circle with label (single circle is entire system) Data flow …data and information elements passing between environmental entities & system
Context Diagram Highest level DFD Has data flows, environmental entities, one process (system in focus) and no data stores. Shows the system boundary and interactions with environmental entities. Environmental entity - Student Process Name - Student Administration System Data Flows - Application Details, Confirmation/Rejection Details
Celis Brewery: Context Diagram for the Proposed IPS & ITS Enhancements Order Requisitions Orders Order Confirmation Suppliers Distributors Order Cancellations Supplies Celis Brewry ITS/IPS Shipment Date Changes Summary of Removals Critical Levels Report Recipients Of Free Beer Beer Management Order Log Report Inventory Log Report Thank You Letters Inventory Discrepancy Report
Group Project 1 Deliveries -- analysis of existing situation • Early tasks • Stakeholder table • Sw & Hw Environments table • Root Cause Analysis • Context Diagram • Data Flow Diagrams Focus on “As Is” Situation
Group Project 1 Deliveries See Specification Step 2 • Stakeholders, Roles, andResponsibilities Table • Software & HardwareEnvironments • Root Cause Analysis • Data Flow Diagrams Last class 333k, 365 HW & this class This class & next class
Group Project 1 Process Suggested order • Stakeholders, Roles, andResponsibilities Table • Software & HardwareEnvironments Table • Root Cause Analysis Use a highlighter and jot notes while you read the case.
`Group Project 1 DFD Process 1. Start Top Down (overview paragraphs) 2. Bottom up next • Design Process • Production Process • Tracking Project Costs Create a rough draft of each of these when you read the case. Create your summary DFDs (the Figure 0 and final Context Diagram) last.