Download
1 / 20
200 likes | 308 Views
Pathways analysis. Iowa State Workshop 11 June 2009. All tools and materials from this workshop are available online at the AgBase database Educational Resources link. For continuing support and assistance please contact: agbase@cse.msstate.edu.

E N D
Pathways analysis Iowa State Workshop 11 June 2009
All tools and materials from this workshop are available online at the AgBase database Educational Resources link. • For continuing support and assistance please contact: agbase@cse.msstate.edu This workshop is supported by USDA CSREES grant number MISV-329140.
Pathways analysis enables • Analysis of data in the context of molecular mechanismsto movebeyond statistical analysis of expression to novel biological insights • Applying biological filters to focus in on the changes most relevant to experimental model • Comparison of affected pathways and phenotypes across platform, time, dose etc (www.ingenuity.com)
What regulatory relationships exist between the genes, proteins in my dataset? Networks Which biological and disease processes are most relevant to my genes of interest? Functional analysis Which well-characterized cell signaling and metabolic pathways are most relevant to my experimental data? Metabolic And Signaling pathways http://www.ingenuity.com
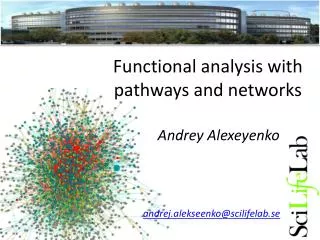
Cytoscape • Cytoscape is a freely-available (open-source, java-based) bioinformatics software platform forvisualizing biological networks (e.g. molecular interaction networks) andanalyzingnetworks with gene expression profiles and other data
Core Features • Customize network data display using visual styles • Powerful graph layout tools • Easily organize multiple networks • Easily navigate large networks • Filter the network • Plugin API
Cytoscape includes a flexible plugin architecture that enables developers to add extra functionality beyond that provided in the core
Some plugins • jActiveModules: identify significant “active” subnetworks • Expression Correlation Network: cluster expression data • Agilent Literature Search: build networks by extracting interactions from scientific literature. • MCODE: finds clusters of highly interconnected regions in networks • cPath: query, retrieve and visualize interactions from the MSKCC Cancer Pathway database • BiNGO:determine which Gene Ontology (GO) categories are statistically over-represented in a set of genes • Motif Finder: runs a Gibbs sampling motif detector on sequences for nodes in a Cytoscape network. • Exhaustive list at http://chianti.ucsd.edu/cyto_web/plugins/index.php
Gene Ontology enrichment analysis BiNGO plugin
Analysis tools(commercial) Networks Ingenuity Pathway Analysis Pathways Functions and diseases http://www.ingenuity.com Gene Ontology (GO) groups Pathway studio GSEA Pathways http://www.ariadnegenomics.com/ IPA analysis included as IPA.txt
Data curation • Ingenuity : Manually curated database by Ph.D level scientists (mining 32 different peer reviewed journals). • Pathway studio : Automated curation by Medscan Reader using Natural language processing (NLP) technology. Mining Pubmed abstracts and peer reviewed journals (users can do their own text mining)
Comparison Criteria • Features • Proportion of proteins involved in modeling • Data generation • Display • Test Dataset: 3,600 bovine spermatozoa proteins (Comparison by Divya Swetha Peddinti)
Data generation 37 7 26
Equally efficient at drawing networks of relationships. • IPA : simplifies the pathway display and creates more manageable user friendly network for users to analyze. • Pathway Studio: Shows the relations in a table format.
Mamamlian ResNet 1.5 Million molecular interactions and functional relationships from the entire PubMed (17,000,000 abstracts) and 61 full text journals for 110,435 proteins 13,533 small molecules 2814 cellular processes 2,410 diseases Pathways: 227 Receptor signaling pathways 21 new cellular process regulation pathways Atlas of Signaling - all cellular signaling on one map Plant ResNet Relations to Arabidopsis proteins, (and rice genes that are mapped to Arabidopsis), Protein annotation for eight other plant species; Over 90,000 functional relationships and molecular interactions from 117,000 plant-specific abstracts and 8 plant-specific full-text journals for 71,501 proteins 3,831 small molecules 915 cellular processes 97 plant diseases Pathways: 17 Plant Signaling Pathways 315 AraCyc pathways Journals: Annals of BotanyCrop ScienceJournal of Experimental BotanyNew PhytologistPlant CellPlant, Cell and EnvironmentPlant JournalPlant Physiology Ariadne supported database statistics