Download
1 / 4
50 likes | 195 Views
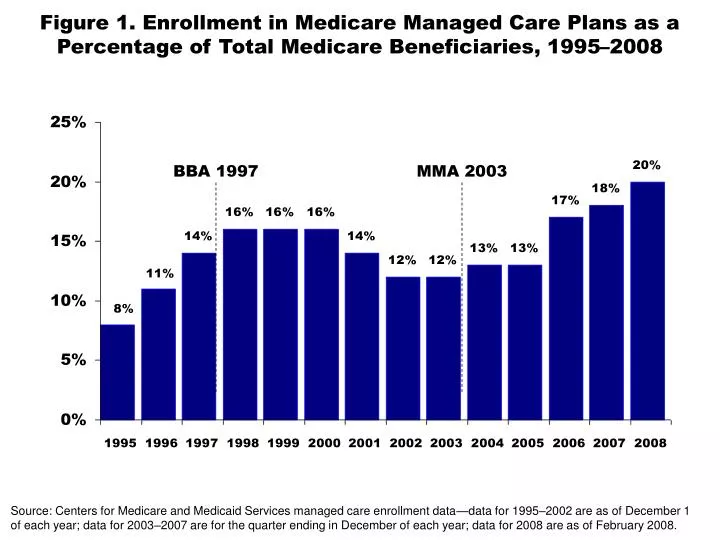
Figure 1. Enrollment in Medicare Managed Care Plans as a Percentage of Total Medicare Beneficiaries, 1995–2008. BBA 1997. MMA 2003.

E N D
Figure 1. Enrollment in Medicare Managed Care Plans as a Percentage of Total Medicare Beneficiaries, 1995–2008 BBA 1997 MMA 2003 Source: Centers for Medicare and Medicaid Services managed care enrollment data—data for 1995–2002 are as of December 1of each year; data for 2003–2007 are for the quarter ending in December of each year; data for 2008 are as of February 2008.
Figure 2. Trends in Total Extra Payments to MA Plans,2004–2008 Total Annual Extra Payments to MA Plans (in Billions) Sources: GWU analysis of CMS Medicare Advantage enrollment and payment rate data for 2004–2006 and MedPAC analysis of MA plan bids for 2006, 2007, and 2008.
Figure 3. Trends in Average Extra Paymentper MA Plan Enrollee, 2004–2008 Average Extra Payment per MA Plan Enrollee Source: GWU analysis of CMS Medicare Advantage enrollment and payment rate data for 2004–2008 and MedPAC analysis of MA plan bids for 2006, 2007, and 2008.
Figure 4. Estimated Savings from the Implementationof a Policy to Reduce Payments to MA Plans to100 Percent of Fee-for-Service Costs, 2009–2017 Total Savings (in Billions) Source: Congressional Budget Office, June 2007.