Download
1 / 28
280 likes | 442 Views
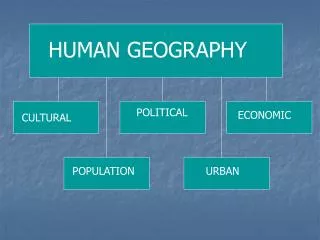
Human Geography. Population Distribution, Density, Dependency Ratio, and Pyramids. April 15, 2014. World Population Growth: Is it Sustainable?. What is it?. Population Distribution. A Population Distribution shows the arrangement of people in a given space .

E N D
HumanGeography Population Distribution, Density, Dependency Ratio, and Pyramids April 15, 2014
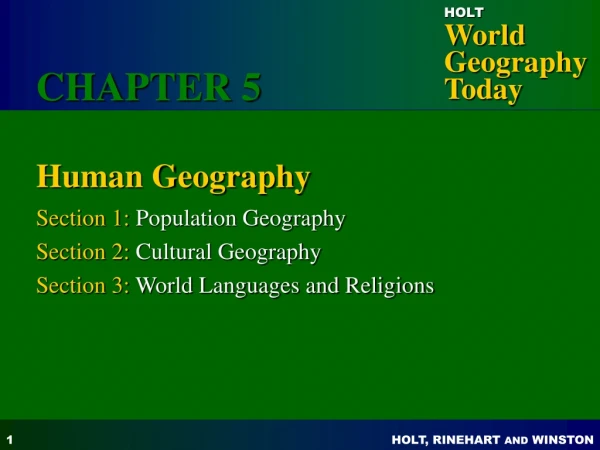
What is it? Population Distribution A Population Distribution shows the arrangement of people in a given space. World population distribution is uneven. Places such as Antarctica or the Canadian Arctic are less habitable and thus, sparsely populated. Places such as Europe or Canada’s Southern Border offer warmer temperatures, and are thus more densely populated.
Population Density What is it? • Population density is the number of people per unit of area, usually quoted per square kilometer. • Population densities can be calculated for towns, cities, provinces, countries, continents, or the entire world! In comparison…. World population density = 53 people per square kilometer Canadian population density = 3.5 people per square kilometer
World Population Density # of people per km2
BritishColumbiaPopulationDensity What are the most densely populated areas in BC?
What is a population Pyramid? A visual representation of a population structure • It is a graph that displays a population's age and gender composition • Shows number or percentage of males and females in each age group (cohort) • Represents a country’s birthrate and death rate • Represents population growth or decline
Population Pyramids 101 Vertical Axis - Age Groups Elderly dependents Working population Young dependents Horizontal Axis – Percentage / number
FEMALES To the right MALES To the left The population pyramid displays the age and gender structure of a country or given area Population in Five Year Age bands Usually, but not always, Given in a percentage to make for easier comparisons between countries
Population Pyramid of a Developing Nation Population Pyramid of Nigeria
InterpretingPopulation Pyramids… • A TRIANGLE (BROAD-BASED) • POPULATION PYRAMID MEANS: • Birth rate is high and Death rate is high • High Infant mortality rate • Low Standard of Living (low income, poor medical care, inadequate food supply or poor water quality).
Population Pyramid of a Developed Nation Population Pyramid of Sweden
InterpretingPopulation Pyramids… • A DIAMOND (BEEHIVE SHAPED) • POPULATIONPYRAMID MEANS: • Birth rate is low and Death rate is low • Low infant mortality rate • High quality of life (high income, access to health care,plentiful food supply and good water quality)
Why are Population Pyramids Important? Each pyramid tells a story about the past, present & future of a country & its people. Allow easy comparison between population structures Assist in Policy Planning future housing estates future schools future jobs
Review: Population Pyramids Worksheet A. Drawing a Population Pyramid Males Females
Review: Population Pyramids Worksheet B. Analyzing a Population Pyramid 2. Which age-sex groups are the largest and smallest? Largest Age-Sex Group: Male, age 50-54 = 3.9% Smallest Age-Sex Group: Male, age 95+ = 0.03% 3. Compare the percentage of males and females age 70+ There are more females because females live longer. 4. What noticeable/outlying age-sex groups can you identify and what historical events can their significance be attributed to? High Population aged 45-60 = THE BABY BOOMERS (born 1950s and 1960s) High Population aged 20-35 = THE BABY BOOM ECHOERS (born 1970s and 1980s)
Age Structure of Population • The age structure of a population helps us understand the reasons for population change • Populations divided into: • Children up to age of 15 • Working adults from age 16-64 • Adults age 65 and older • This gives the dependency ratio, or proportion of the population being supported by the working age group
Age structure of Canada • Children and older people put pressure on society for: • Medical, education, housing, etc • 1996: Canada population included: • 21% children, 12% older adults, so… • Dependency ratio of 33% • This means one in every three people in Canada isn’t earning their own money
How does the population of Canadian Aboriginals compare to that of Non-Aboriginals? Why do you think this is the case? Think, Pair, Share!!!
Examining Aboriginal Demographics • A Small and Diverse Population • According to the 2011 Census, there was a total of 1,400,685 Aboriginal people in Canada, comprising 4.3% of the Canadian Population
Examining Aboriginal Demographics • A Very Young Population • The Aboriginal population is much younger than the non-Aboriginal pop. • In 2006, 48% of the Aboriginal population was under the age of 25 compared with 31% of the non-Aboriginal population • In 2011, the average age of • the Aboriginal population was • 27.7 years of age, compared • with 40.6 years of age for • non-Aboriginal people.
Examining Aboriginal Demographics • A Fast Growing Population • Canada's Aboriginal population is growing faster than the general population, increasing by 20.1% from 2006 to 2011 • This is due to a • higher fertility rate • among Aboriginal • women than among • other Canadian • women.