Download
1 / 32
320 likes | 370 Views
Q repeat 9 interval amino acid forms in man and pathogen. Visualization and molecular weight *Fasta context to graphed data as process. Sites:. http://wit.mcs.anl.gov/WIT2/CGI http://www.sanger.ac.uk/ http://www.embl-heidelberg.de/ http://www.expasy.ch/

E N D
Q repeat 9 interval amino acidforms in man and pathogen Visualization and molecular weight *Fasta context to graphed data as process.
Sites: • http://wit.mcs.anl.gov/WIT2/CGIhttp://www.sanger.ac.uk/ • http://www.embl-heidelberg.de/ • http://www.expasy.ch/ • http://protein.toulouse.inra.fr/prodom.html • http://www-sv.cict.fr/bacterio/
By Mark McGary This slide presentation is designed to introduce advanced concepts in assay of amino acid forms in pathogen and man. It includes a repeat set that includes both TB and man. Those are depicted among the graphed data shown.
A note about passion for this subject. • Nothing has so transformed my view about the nature of fundamental comparisons using genomic tools as the task of translating the German text of Dr. Robert Koch from the written German to English.
Among the data of tuberculin production....and the view of a superb clinician working to combat disease, • Koch is available to the reader as a man who began to medically understand aspects of TB. At the time of Koch’s inquiry..... • Tools using genomic functions were unavailable.
Dr. Koch reached an impasse within the technology of his time. Students and researchers of the year 2000 have available a formidable advance in conceptual and comparative data to further assay Homo sapiens and disease. Ask yourself....”Why is this important to an understanding of TB, Public Health Epidemiology and disease?”
Taking the critical care needed to build genomic tools is the passage to a larger understanding of pathogen man interaction. • In Mycobacterium tuberculosis....and others...is a formidable set of opponents. Within this field...must come such comparisons and the reach for larger impact on medicine and public health.
Goals • Identify and quantify underlying molecular chemistry in known amino forms • Observe similarities available that demonstrate repeat regions in pathogen and man in experimental relationships. • The methods and graphs that follow are only the opinion of the author...and represent theory...with “Data” in test graphs.
These findings are prototypes of a new form of assay and use graphs that may be revised.I invite the student to use similar ...ideas and share those concepts .
WIT 2 : FASTA derived similarity search address: http://wit.mcs.anl.gov/WIT2/CGI* WIT includes a set of over 2900 diagrams depicting metabolic pathways. This collection is from the Metabolic Pathway Database constructed by Evgeni Selkov and his team. Each pathway diagram includes a set of functional roles. The goal of producing a metabolic reconstruction is to identify which pathways are present in an organism and which genes implement the functional roles.
The relational table representing the pathway collection includes two columns: a pathway identifier and a functional role (there will be multiple rows for each pathway). For each organism, we include a list of pathways present in the organism. For each organism, we include a table connecting genes (ORFs) to hypothesized functional roles.“FASTA” ... is a language that describes amino forms along DNA strands, widely used within science as a method to quantify amino sequence.
FASTA to underlying amino acid chemistry: Mole weight by assigned groupings: “Quantative assignment”.
As I observe “interval repeats” to occur in other lesser and greater lengths, I find it compelling that the 11 region assay is found among man’s critical tissues of brain stem, bone marrow and hepatic sites...with amino characters and the repeats among the pathogens that mirror length. Exploring this issue among the like regions of Homo sapiens and gram negative bacilli continues to remain for the author...an interesting exercise. I continue to remark on this interesting finding and explore other repeat contigs that propose method in interval forms.
Method:Foremost ...among observation...has come the regard for examining the pattern of Q – nine interval – Q form.Typically, this type of domain as a contig is highly conserved in MTB37Rv.I provide examples:with several results graphed.
I want to demonstrate specific aspects of the artifacts I observe in MTB 37 Rv (Tb.) as regard man as a host.In comparison with M. bovis, T. pallidum, Streptococcus, Falciparium, et al and man...MTB 37 Rv’s sequence demonstrates a direct corollary of sequence length *(contig site variable). I comment upon this finding and further demonstrate the availability of the repeat similarity match sets routinely found at Expasy, EMB, WIT site(s).
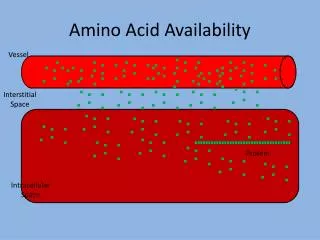
The method I have found of most use “routinely probes contig composition” ...that is...exactly... “the sequence forms of amino structure toward pathogen and man”.As to form and shape..a natural assignment has been to quantify the underlying chemistries. Thus, the determining of mole weight of the amino forms is observed to have good precision and allows comparative graph.I include several so that the reader may trace the development of multiple pathogens ...human contig intersect
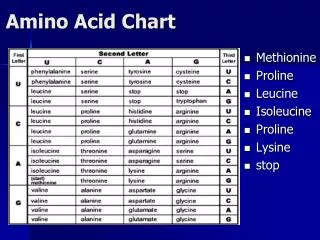
Genetic interval to Mole Weight • Foremost ...among observation...has come the regard for examining the pattern of Q – nine interval – Q form. Examples: • QKLVSSHKPVQ – Homo sapiens • QKLVSSHKPVQ – Pathogen and man list: • QRLAAERDAAQ - • Mycobacterium avium: QMIRLATERDQ • Mycobacterium tuberculosis: QSVALYLGKGQ • Mycobacterium bovis: QILASGLTVSQ
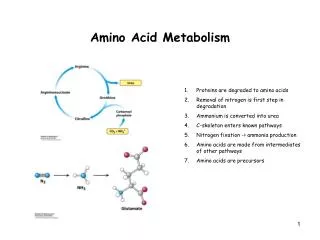
DNA in pathogen(s) and Homo sapiens share common features among the genetic information available to the student. Translation of the genetic alphabet to mole weight form is a critical skill to assay DNAWhat is most important to learn? • FASTA is a language representing amino forms of DNA. Repeats of these regions can be identified. • Identification and subsequent mole weight mapping follows.
119.12 threonine 168.0538 selenocysteine 117.1474 valine Fasta forms represent a “shorthand “ of chemistry as each letter represents a known amino form. Those forms are shown here (examples only/ above)with the accompanying data of mole weight.
Information from QKLVSSHKPVQ Can translate to Q = 146.1456 glutamine ect. Translation of Fasta form to mole weight number sets can now occur With a table of values....many forms can be examined to represent amino -subset comparisions.
A set of similar forms can become a numerical grid..suitable to graph.The following slides are a translation of ten each....amino acid repeat regions. They include man, TB, and F.malaria regions of 11 repeat.Graphs of this data follows.
A comparative view of amino forms of man and pathogen (10 ea) I invite the student to demonstrate further comparative views. My favorite is shown below. Man and disease share “Q repeat” regions shown as graphed colors.
All of the graphs that follow represent graphed forms of amino molecular weight. This represents a concept that the student can further explore with forms from among sequences widely published.
Eight slides will follow.The slides use the same number sets as shown.... to provide a computer model for a graphed form.
My favorite view of shared amino forms. 11 interval findings! Notice the species variation....shared endpoints!