Download
1 / 10
100 likes | 194 Views
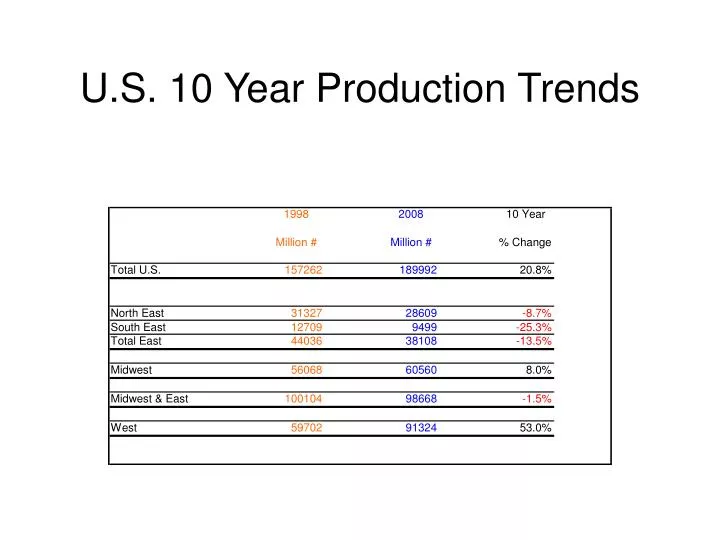
U.S. 10 Year Production Trends. CME Class III Prices and Trend. Ration-all Pricing Proposal. Two Tiered Market Based Pricing - Uses a 5 year trend to price 90% of production base. - Trend price eliminates volatility but reflects market history.

E N D
Ration-all Pricing Proposal • Two Tiered Market Based Pricing - Uses a 5 year trend to price 90% of production base. - Trend price eliminates volatility but reflects market history. - Provides a stable price to allow for proper decisions in a business that requires high capital long term investment. - Provides a stable price for processors, wholesalers, retailers and consumers. - Stable prices will allow coops and processors to enter into longer term contracts and eliminating extreme volatility in product pricing and values of their inventories. - Eliminates the need for price floors and subsidies.
Ration-all Pricing Proposal - Trend price uses 5 previous years to project the base price 12 months in advance at the end of each month. • Each federal order price history will be used to develop the trend for that federal order. • The milk produced over the 90% of base will be priced separately in each federal order based on an average of the bids that expect to be filled. • Each market administrator will accept bids up to 20th of the month prior to the month being bid for. • The bids that expect to be filled will be averaged and then that price will be announced by the 25th of the month prior to the month being bid.
Ration-all Pricing Proposal - The bid price can still be volatile to reflect the current supply and demand situations in each federal order. • Since the price of the over base milk will be announced before it is produced the dairyman can decide how much of this milk he is willing to produce at the announced price. Plentiful milk supply will likely result in bid prices lower than trend price for the over base milk. The key is that now the dairyman is more likely to respond properly to the market signal by reducing the amount of milk he produces at the lower price because he is still able to cash flow based on the income from the 90% of base milk priced at the trend. • The bidding system assures that milk will be used for the highest value products.
Ration-all Pricing Proposal • Bidders are free to bid in other markets for the over base milk but are responsible for the transportation cost from the receiving plant to their plant. This allows milk to be produced in areas that are capable of producing milk for less only to the extent that it includes the cost to transport to the consumer. • The blended price for the current month is determined by a weighted average using the current bid price for milk produced over the base milk and the 90% base milk priced from the trend to determine a new blended price to enter into the trend program to project the next year’s trend price.
Ration-all Pricing Proposal • The previous Class III chart illustrates how the price will be stabilized. • Red line charts actual class III price history 2004 – 2008. The blue line charts the actual class III 2009 which for this example will represent the bid price that would be paid on the over base milk. The trend line represents the 5 year trend of the class III milk with 2009 projection price to be the price paid for the 90% of base milk. The yellow line represents what the blended price the dairyman would receive if he shipped the same amount of milk as his total base production. I believe the low bid price in this example will reduce the excess production to keep supply and demand in balance faster than pricing all the milk at this lower price as the current system does because the dairyman can still cash flow with the 90% base milk priced at the trend.
Ration-all Pricing Proposal - This eleven year class III chart illustrates approximately how the price would have been stabilized if I started this two tiered pricing system at the beginning of 2006. The red line represents the actual CME class III price. The yellow represent the eleven year trend line. The brown represents the 2009 class III price. The blue represents what the blended price would have been using the two tiered pricing if the dairyman shipped the same amount of milk as his base.