Download
1 / 33
330 likes | 431 Views
The National Rivers and Streams Survey – An Overview and Results. Presentation Outline. Background NRSA Approach Results Next Steps. What is NARS?. Series of surveys implemented by EPA and our state and tribal partners Assess all surface waters within the 48 contiguous states

E N D
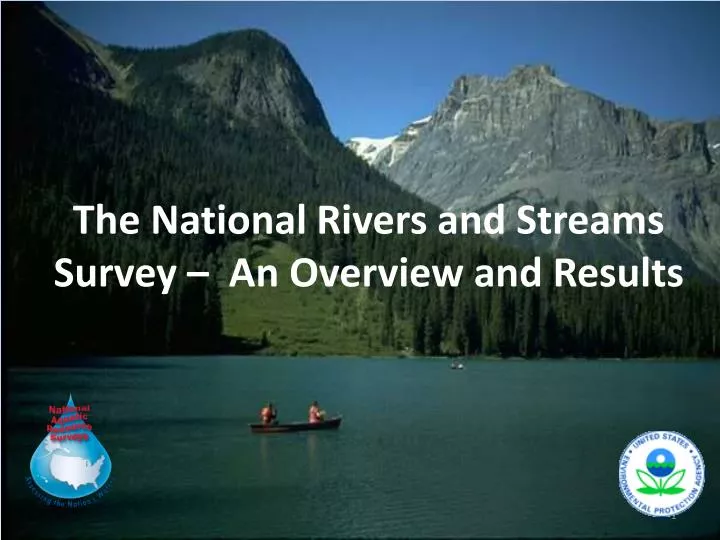
The National Rivers and Streams Survey – An Overview and Results
Presentation Outline • Background • NRSA Approach • Results • Next Steps
What is NARS? • Series of surveys implemented by EPA and our state and tribal partners • Assess all surface waters within the 48 contiguous states • Cost effective, nationally consistent, regionally relevant means of tracking status and trends • Builds from almost 20 years of research and pilots Coastal Streams and Rivers Wetlands Lakes
Purpose of the National Aquatic Resource Surveys • Assessing biological and recreational condition using indicators of condition and stress • Documenting associations between indicators of condition and indicators of stress • Building/enhancing state monitoring and assessment capacity
Why is NARS Important? • Fills critical water quality data gaps • Statistical design provides national and regional conclusions on the health of broad population of waters, and changes over time, without sampling every water • Core indicators provide nationally consistent assessment relevant to Clean Water Act goals • Delivers data and reports that address nationally important policy questions • NARS data and results support important agency priorities (e.g., nutrients in the Mississippi River Basin) • Complements states’ and other targeted, site- • specific assessments
NARS Approach: National Consistency • Statistically representative design --Allows reporting on condition of each resource nationally and on a regional basis with documented confidence • Standard field and lab protocols -- All indicators evaluated for credibility, to address national and state-identified needs • National quality assurance and data management -- All partners use EPA-developed quality assurance project plan • Nationally consistent and regionally relevant data interpretationand peer-reviewed reports --Informal and formal peer review
Accomplishments • Nationally consistent and scientifically defensible reports • Linking results to policy issues • Advancements in monitoring methods and expanding monitoring of more waterbody types • Advancing and fostering analyses • Biological indicator development • Relative risk and attributable risk analyses
Draft National Rivers and Stream AssessmentNRSA 2008/09 Overview and Key Findings
National Rivers and Streams Assessment is the latest National Aquatic Resource Survey • First nationally-consistent, statistically representative assessment of the nation’s rivers and streams • Biological and habitat condition • Major stressors • Key human health indicators • Change in stream condition • The 1,942 sites sampled – plus 234 hand-selected reference sites and 200 re-sample visits – describe the condition of perennial stream and river miles across the lower 48 states
NRSA 2008/09: Design of the Survey All streams and rivers within the 48 contiguous states that have flowing water during the study index period Includes major rivers (including Great Rivers) and small streams Includes run-of-the-river ponds and pools with less than 7 day residence time Must have > 50% of the reach length with standing water The target population excludes: Tidal rivers and streams up to head of salt Slow moving reservoirs
Statistical Distribution of Sample Sites • Represents 1,194,000 million miles of rivers and streams
In the Field: 2008-2009 Index Period: Late May to end of September In the Field: 2008-2009 • Index Period: Late May to end of September • Sites Sampled: Over 2,300 sites sampled • Field Crews: States, Tribes, EPA, USGS, NPS Field Crews: States, Tribes, EPA, Contractors, USGS, NPS Standard methods and indicators
Benthic macroinvertebrates Water quality Algal community Fish community and fish tissue Physical habitat Recreational Indicators
Highlights include: • Urban Waters for Fish Tissue PCBs and PFCs • State Example for NRSA • Importance of nutrients Draft NRSA Report for Public Comment includes: • Biological Integrity • Benthic Macroinvertebrates • Fish Community Assemblage • Periphyton Assemblage • Habitat Quality • Excess Sedimentation • Riparian Disturbance • Human Influence • In-stream fish habitat • Chemical stressors • Nutrients (Nitrogen, Phosphorous) • DO • Salinity • Change in stream condition • Compared to 2004 streams report • Human Health • Enterococci • Fish Tissue: Mercury • EcoRegion Summaries
Determining Thresholds: Setting the Bar • Reference Condition: Least disturbed condition • Represents ‘best of what’s left’ in an altered landscape • Baseline for evaluation of survey data • Set good/fair/poor condition categories for most indicators Telegraph Creek, FL http://water.dep.state.fl.us Rock Bridge Fork, KY www.water.ky.gov
Determining Thresholds:Setting the Bar For the NRSA, two types of thresholds were used to determine condition: • Regionally reference-based thresholds • Fixed percentile defines good/fair and fair/poor • Applied to bioindicators, habitat indicators and major stressors • National consistent thresholds • Screening thresholds developed by EPA that are protective of human health • Applied to human health indicators Poor 95% Fair 75% Good Example Stressors
Biological Condition of the Nation’s Rivers and Streams: Benthic Macroinvertebrates • Multi Metric Index (MMI) combines 6 measures of community integrity. • Primary Biological Condition Indicator • Widely used by States and academics • Integrates stressors over long periods of time • Regionally based MMI’s and condition categories • Other Biological Condition Indicators: Fish Assemblage and Periphyton
Key Findings – Biological Condition 55% of our nation’s river and stream miles are in poor biological condition, 23% are in fair condition, and 21% are in good condition. Rivers and streams that are in fair or poor biological condition can lead to loss of fishing and recreational opportunities. Compared to a 2004 stream assessment, 7% fewer stream miles are in good biological condition.
Water Chemical Stressors • Compared to ecoregional reference thresholds • Parameters reported: • Total Nitrogen • Total Phosphorus • Salinity • Acidification
Physical Habitat: Crews measure hundreds of aspects of the stream and river physical habitat to assess its condition. Quantitative measure of stream habitat condition. Riparian Disturbance Excess Sedimentation In-stream Fish Habitat Riparian Vegetative Cover
Key Findings from the NRSA – Major StressorsNutrients and poor habitat continue to be widespread problems • Nutrients: • 40% of the nation’s river and stream miles have high levels of phosphorus • 27% have high levels of nitrogen • Habitat: • Poor quality vegetative cover iswidespread in 24% of rivers/streams • High levels of human disturbance near river and streambanks occur at 20% of the nation’s river and stream miles
Key Findings from the NRSA – Change in Streams Compared to a 2004 streams study, detectable changes occurred in streams. The direction of change varied for different stressors. Determining why and identifying trends will take more years of data. • Biology and phosphorus: Fewer stream miles in good condition • 7% fewer stream miles in good biological condition • 19% fewer stream miles in good condition for phosphorus. • Nitrogen and habitat: More stream miles in good condition • 9% more stream miles in good condition for nitrogen • 17% more stream miles in good condition for in-stream fish habitat • 12% more stream miles in good condition for human disturbance
Key Findings in the NRSA – Human HealthTwo indicators that show potential risk to human health -- enterococci bacteria and mercury in fish tissue -- are widespread in rivers and streams. • In 9% of river and stream miles, enterococci exceed thresholds protective of human health. • Over 13,000 miles of rivers are found to have mercury in fish tissue at levels that exceed thresholds protective of human health.
Stressor Extent and Resulting Risk: Relating Stressors to Biological Condition • NRSA evaluated stressors against biological condition, to assess which are most important. • Examination of the relationship between three indicators provides: • Relative Extent – What is the proportion of stressors in poor condition? • Relative Risk – When stressors indicate poor condition, what is the increased proportion of river and stream miles with poor biological condition? • Attributable Risk – What percent of river and streams miles that are in poor biological condition should move to good/fair if this stressor is eliminated?
Stressors of the NRSA:Extent, Relative Risk, and Attributable Risk • RE- Total Phosphorous: Most widespread stressor across the U.S. • RR- Poor biology is 50% more likely when high levels of phosphorus present. • AR –IF phosphorous levels were reduced to “low,” 10% of river and stream miles would move into the good condition class for biologic condition.
Regional Assessments Northern Appalachians Southern Appalachians Upper Midwest Coastal Plains Temperate Plains Southern Plains Northern Plains Western Mountains Xeric West
Next Steps for the NRSA • Complete analysis and publications on supplemental indicators and new approaches • Additional fish tissue data • Random Forest Model for the Macroinvertebrate MMI • Invite others to download the data sets for exploration and analysis • Work with States and other Clean Water Act programs to analyze data in their programmatic context • Present results at several upcoming meetings with Regions, States, and academics • Initiate next round of sampling for the 2013/2014 National Rivers and Streams Assessment
National Rivers and Streams Assessment Report Intro and Design National Findings Ecoregional Findings Change over Time Future Actions – NRSA in 2013/14 Human Health Indicators
Upcoming Milestones- NARS • National Rivers and Streams Assessment 2008/09 • 1st draft report on all flowing waters out for public review until May 9 • National Rivers and Streams Assessment 2013/14 • Field season beginning in May for 2nd NRSA • National Wetlands Condition Assessment 2010 • Complete data QA and conduct data analysis and peer review • Release 1st National Wetland Condition Report • National Coastal Condition Assessment 2011 • Complete data QA and conduct data analysis and peer review • Release NCCA V report • National Lakes Assessment 2012 • Complete lab work and data QA in preparation for 2nd national lakes assessment • Conduct data analysis and peer review • Release 2nd National Lakes Assessment