Download
1 / 16
160 likes | 339 Views
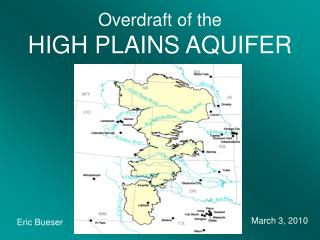
Study on scaling property of Topindex and the aquifer rating-curve in Illinois with the application of TopModel CE394K Term Project Presentation Hua Su. Outline:. Introduction

E N D
Study on scaling property of Topindex and the aquifer rating-curve in Illinois with the application of TopModel CE394K Term Project Presentation Hua Su
Outline: • Introduction • Basic concept of Topmodel and physical interpretation of relationship between Topindex and groundwater discharge and water table; • Scaling property of Topindex in Illinois region; • The observational groundwater rating curve and exponential function fitting in Illinois • Examine the Topmodel’s assumption on vertical variation of soil hydraulic transmissivity • Discussion
Introduction • Water cycle is an integrated system based on Hydrology-Geomorphology-Climatology; • Topmodel describes the interaction between Topography and hydrologic process and the Topindex is a Key variable when applying Topmodel; • Analyzing spatial pattern of Topindex and the performance of Topmdel based on examing its assumption are objective in this project
Stream line Contour line a r r Upslope contributing area a q=a*r tgB Basic Concept of Topmodel Water balance and Darcy function in subsurface q=a*r=T0*exp(-fZ)*tanB (Beven,1978; Sivapalan,1990) Definition of Topindex ——Ln[a/tg(B)] Variable determined only by Topography
Local water table depth as a function of Topindex Z=-1/f*[Ln(r/T0)+Ln(a/tg(B))] (1) • For given recharge rate r and soil hydraulic conductivity, in equation (1) the Topindex has a linear relationship with the water table depth; That means the topography becomes a major factor controlling the groundwater storage at local scale when aquifer is wet;
Scaling property of Topindex in Illinois The Log-Log relationship between the spatial Variance of Topindex and the spatial resolution (the area of grid scale) of the Topindex in Illinois; The figure shows the Topindex is not scaling invariant. When the spatial scale increase, the variance of Topindex increase.
The Topmodel provide a scheme to estimate the aquifer groundwater discharge based on the spatial mean value of water table. Q=Qo*exp[-f*Z(mean)] (2) ——Aquifer rating curve Here f is assumed to be the parameter to describe the exponential relationship between soil transmissivity and soil depth. T=T0*exp(-f*Z)
Test this assumption of Topmodel Use observation data to fit the exponential style of aquifer rating-curve and estimate f1; Using soil data to fit the exponential style of the soil transmissivity and estimate f2 Compare f1 and f2
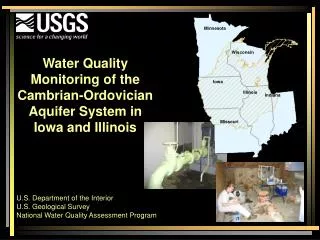
Henry f=0.808 Champaign f=2.468 Greene f=1.08 Fayette f=2.611 Randolph f=0.338 Using monthly streamflow data and water table data in the 5 locations in Illinois to fit the exponential function of the rating curve; Streamflow data is from USGS and the water table data is from Illinois State Water Survey
The exponential style of vertical variation for soil hydraulic transmissivity is fitted by soil data from STATSGO. • STATSGO is the short name for “Soil maps for the State Soil Geographic (STATSGO)” database. • It provides comprehensive soil information including the SSC percent, soil hydraulic conductivity and soil layer thickness in each state with polygon format and dbf format which are readable by GIS. • The spatial resolution of STATSGO is limited so we can only get the soil hydraulic transmissivity in an area which is around or include the test location and get an approximate parameter in the exponential curve estimation on that location.
Method T(Zi)=T0*exp(-f*Zi) (3) Zi: The thickness of soil in each soil layer T(Zi): The total transmissivity from Zi to the immpermiable rock Zi and T(Zi) can be derived from STATSGO dataset Using nonlinear optimization to get f and T0 in equation(3)
Conclusion and Discussion 1. The aquifer rating curve in the test Illinois can be estimated by exponential function, which is widely used in Topmodel and other model to simulate the groundwater discharge; 2. Topmodel assume that the exponential factor f in the rating curve is caused by the soil hydraulic transmissivity has exponential relationship with the soil thickness; while our test shows that this assumption seems not to be reasonable at some locations of Illinois. 3. The exponential factor f2 computed with STATSGO data need improved since the STATSGO data has limited resolution.