Download
1 / 36
360 likes | 489 Views
Assessing and Addressing Disproportionate Minority Contact (DMC) in Juvenile Justice. April 9, 2007. Bill Feyerherm, Ph.D., Vice Provost for Research,. Overview. The Big Picture – The DMC Process Identification Creating and Using the Relative Rate Index Selecting Areas of Concern

E N D
Assessing and Addressing Disproportionate Minority Contact (DMC) in Juvenile Justice April 9, 2007 Bill Feyerherm, Ph.D., Vice Provost for Research,
Overview • The Big Picture – The DMC Process • Identification • Creating and Using the Relative Rate Index • Selecting Areas of Concern • Assessment • Generating possible explanations related to the Areas of Concern • Using Data to select targets • Bringing it together – the example of Multnomah County
National Custody Data, 2003 On a typical day in 2003 • 190 of every 100,000 white juveniles were in custody • 754 of every 100,000 Black juveniles were in custody • 496 of every 100,000 Indian juveniles were in custody • The Custody Rate for Black Youth was 4 times higher than for White Youth • The Custody Rate for Indian Youth was 2.4 times higher than for White Youth
DMC As A Core Requirement in the JJDPA of 2002 States are required to “address juvenile delinquency prevention efforts and system improvement efforts designed to reduce, without establishing or requiring numerical standards or quotas, the disproportionate number of juvenile members of minority groups, who come into contactwith the juvenile justice system”.
Defining DMC Disproportionate • A rate of contact with the juvenile justice system among juveniles of a specific minority group that is significantly different than the rate of contact for whites (i.e., non-Hispanic Caucasians) or for other minority groups.
Defining DMC Minority: Race & Ethnicity Categories: (1) White (non-Hispanic) (2) American Indian or Alaska Native (non-Hispanic) (3) Asian (non-Hispanic) (4) Black or African American (non-Hispanic) (5) Hispanic or Latino (6) Native Hawaiian or Other Pacific Islander (non-Hispanic)
Arrest (Initiallegal encounters with law enforcement) Diversion Detention (pre-adjudication) Referral to juvenile court Issuance of petition Adjudication as delinquent Placement on probation Placement in secure juvenile correction Transfer to adult court Others (e.g., aftercare; revocation of aftercare) Defining DMC Juvenile Justice System Contact
Phase 1. Identification • Answers the questions: • Does DMC exist? • If so, where on the juvenile justice continuum? • And with what minority population? • To what extent? 2-1
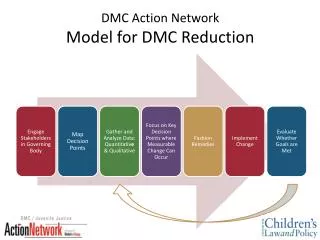
Basic Steps: Calculating the RRI • Create a model of the justice system, showing the major steps / stages of activity. • Record the volume of activity passing through each stage of the JJS during a year for each race / ethnicity group. • Compute the rate of occurrence at each stage for each racial / ethnic categories. • Divide the rate for the minority group by the rate for the white group to create the Relative Rate Index (RRI). • Test to determine if the RRI is statistically significant – whether it is sufficiently different from a neutral value (1.00) that the differences in the rates are not likely to be the result of random chance processes.
Base for Rate Calculations • Juveniles arrested—rate per 1,000 population • Referrals to juvenile court—rate per 100 arrests • Juveniles diverted before adjudication—rate per 100 referrals • Juveniles detained—rate per 100 referrals • Juveniles petitioned—rate per 100 referrals • Juveniles found to be delinquent—rate per 100 youth petitioned (charged) • Juveniles placed on probation—rate per 100 youth found delinquent • Juveniles placed in secure correctional facilities—rate per 100 youth found delinquent • Juveniles transferred to adult court—rate per 100 youth petitioned 2-13
Relationship of Data Elements for Relative Rate Index Calculations
How do we Interpret RRI values? Step 1. Statistical significance Step 2. Magnitude of RRI Step 3. Volume of activity Step 4. Comparison with other jurisdictions
County Level Analyses: Median RRI scores Based on analysis of 150 US Counties
Using the RRI: Moving Toward Assessment • The RRI is like vital signs in a health care setting – it can tell us if we need to pay attention and can guide us to the general area to receive attention. • However, taken alone, it doesn’t tell us if we have a problem that needs to be addressed with intervention, let alone what intervention to use.
Phase 2. Assessment Purpose of Assessment: • To determine probable explanations for the ways in which DMC is created • To determine possible targets for intervention activities 3-1
Diagnosis Determines Treatment
Mechanisms Leading to DMC(A partial listing modified from JRSA “Seven Steps” manuscript ) • Differential Offending • Drugs / gangs / serious offenses • Importation / displacement effects • Repeated offending • Indirect effects • Factors such as SES or Risk Factors which are linked to race / ethnicity
Mechanisms Leading to DMC(A partial listing modified from JRSA “Seven Steps” manuscript ) • Differential Opportunities for Prevention and Treatment • Access • Implementation • Effectiveness • Differential Handling • Decision making criteria • Cultural Competence: interpretation of language and behavior
Mechanisms Leading to DMC(A partial listing modified from JRSA “Seven Steps” manuscript ) • Justice By Geography • Legislation, Policies, Legal Factors with Disproportionate Impact • Accumulated Disadvantage • Statistical Aberrations: Census and record keeping issues, small number issues
Bringing It Together:The Multnomah County Experience • Identification Studies highlighted detention and sentencing as areas of focus • The JDAI (Juvenile Detention Alternatives Initiative) became a resource option • 1994: approx 6000 intakes, 11% detention rate for white youth, 21% for Black youth, 23% for Hispanic youth
Assessment issues • Lack of alternatives • Lack of good control over decision processes • Concerns about the Cultural Competence of Staff
Implementation - Developing Alternatives • Geographic location • Community based provider agencies • Alternatives to assist youth in establishing & maintaining community ties
Implementation: the RAI • Working Team included culturally diverse set of most stakeholders • Examination of models in other communities • Examination of items that inadvertently disadvantage minority youth • Consensus among decision makers • Point based objective criteria for detention decisions.
Implementation: Cultural Competence • Staff hiring policies and goals – staff should reflect the demography of our clients • Agency wide Cultural Competence training
Overview • The Big Picture – The DMC Process • Identification • Creating and Using the Relative Rate Index • Selecting Areas of Concern • Assessment • Generating possible explanations related to the Areas of Concern • Using Data to select targets • Bringing it together – the example of Multnomah County