Download
1 / 38
380 likes | 480 Views
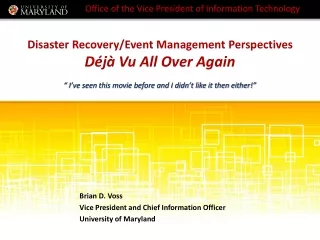
"Positioning University of California Information Technology for the Future: State, National, and International IT Infrastructure Trends and Directions.". Invited Talk The Vice Chancellor of Research and Chief Information Officer Summit

E N D
"Positioning University of California Information Technology for the Future: State, National, and International IT Infrastructure Trends and Directions." Invited Talk The Vice Chancellor of Research and Chief Information Officer Summit “Information Technology Enabling Research at the University of California” Oakland, CA February 15, 2005 Dr. Larry Smarr Director, California Institute for Telecommunications and Information Technology Harry E. Gruber Professor, Dept. of Computer Science and Engineering Jacobs School of Engineering, UCSD
A Once in Two-Decade Transition from Computer-Centric to Net-Centric Cyberinfrastructure Bandwidth is getting cheaper faster than storage.Storage is getting cheaper faster than computing. Exponentials are crossing. “A global economy designed to waste transistors, power, and silicon area -and conserve bandwidth above all- is breaking apart and reorganizing itself to waste bandwidth and conserve power, silicon area, and transistors." George Gilder Telecosm (2000)
Parallel Lambdas are Driving Optical Networking The Way Parallel Processors Drove 1990s Computing (WDM) Source: Steve Wallach, Chiaro Networks “Lambdas”
Optical WAN Research Bandwidth Has Grown Much Faster than Supercomputer Speed! Terabit/s 32 10Gb “Lambdas” Bandwidth of NYSERNet Research Network Backbones Gigabit/s 60 TFLOP Altix 1 GFLOP Cray2 Megabit/s T1 Source: Timothy Lance, President, NYSERNet
NLR Will Provide an Experimental Network Infrastructure for U.S. Scientists & Researchers “National LambdaRail” Partnership Serves Very High-End Experimental and Research Applications 4 x 10Gb Wavelengths Initially Capable of 40 x 10Gb wavelengths at Buildout Links Two Dozen State and Regional Optical Networks First Light September 2004
NASA Research and Engineering Network Lambda Backbone Will Run on CENIC and NLR Next Steps 1 Gbps (JPL to ARC) Across CENIC (February 2005) 10 Gbps ARC, JPL & GSFC Across NLR (May 2005) StarLight Peering (May 2005) 10 Gbps LRC (Sep 2005) NREN WAN • NREN Goal • Provide a Wide Area, High-speed Network for Large Data Distribution and Real-time Interactive Applications NREN Target: September 2005 StarLight • Provide Access to NASA Research & Engineering Communities - Primary Focus: Supporting Distributed Data Access to/from Project Columbia GRC GSFC ARC LRC JPL MSFC 10 Gigabit Ethernet OC-3 ATM (155 Mbps) • Sample Application: Estimating the Circulation and Climate of the Ocean (ECCO) • ~78 Million Data Points • 1/6 Degree Latitude-Longitude Grid • Decadal Grids ~ 0.5 Terabytes / Day • Sites: NASA JPL, MIT, NASA Ames Source: Kevin Jones, Walter Brooks, ARC
Lambdas Provide Global Access to Large Data Objects and Remote Instruments Global Lambda Integrated Facility (GLIF)Integrated Research Lambda Network www.glif.is Created in Reykjavik, Iceland Aug 2003 Visualization courtesy of Bob Patterson, NCSA
A Necessary Partnership: Campus IT Specialists and Faculty, Staff, and Students Source: Enabling the future: IT at Purdue Enabling learning, discovery, and engagement is more than just offering compute cycles. It requires creating a collaborative environment where IT specialists collaborate with faculty, staff, & students so that computing is transparent.” -- James Bottum, VP for Information Technology, CIO, Purdue University
The OptIPuter Project – A Model of Cyberinfrastructure Partnerships • NSF Large Information Technology Research Proposal • Calit2 (UCSD, UCI) and UIC Lead Campuses—Larry Smarr PI • Partnering Campuses: USC, SDSU, NW, TA&M, UvA, SARA, NASA • Industrial Partners • IBM, Sun, Telcordia, Chiaro, Calient, Glimmerglass, Lucent • $13.5 Million Over Five Years • Driven by Global Scale Science Projects NIH Biomedical Informatics NSF EarthScope and ORION Research Network http://ncmir.ucsd.edu/gallery.html siovizcenter.ucsd.edu/library/gallery/shoot1/index.shtml
Optical Networking, Internet Protocol, ComputerBringing the Power of Lambdas to Users • Extending Grid Middleware to Control: • Clusters Optimized - Storage, Visualization, & Computing • Linux Clusters With 1 or 10 Gbps I/O per Node • Scalable Visualization Displays with OptIPuter Clusters • Jitter-Free, Fixed Latency, Predictable Optical Circuits • One or Parallel Dedicated Light-Pipes • 1 or 10 Gbps WAN Lambdas • Uses Internet Protocol, But Does NOT Require TCP • Exploring Both Intelligent Routers and Passive Switches • Applications Drivers: • Earth and Ocean Sciences • Biomedical Imaging
GeoWall2: OptIPuter JuxtaView Software for Viewing High Resolution Images on Tiled Displays This 150 Mpixel Rat Cerebellum Image is a Montage of 43,200 Smaller Images Green: The Purkinje Cells Red: GFAP in the Glial Cells Blue: DNA in Cell Nuclei Source: Mark Ellisman, Jason Leigh - OptIPuter co-PIs 40 MPixel Display Driven By a 20-Node Sun Opteron Visualization Cluster
Tiled Displays Allow for Both Global Context and High Levels of Detail—150 MPixel Rover Image on 40 MPixel OptIPuter Visualization Node Display "Source: Data from JPL/Mica; Display UCSD NCMIR, David Lee"
Interactively Zooming In Using EVL’s JuxtaView on NCMIR’s Sun Microsystems Visualization Node "Source: Data from JPL/Mica; Display UCSD NCMIR, David Lee"
Highest Resolution Zoomon NCMIR 40 MPixel OptIPuter Display Node "Source: Data from JPL/Mica; Display UCSD NCMIR, David Lee"
Currently Developing OptIPuter Software to Coherently Drive 100 Mpixel Displays • Scalable Adaptive Graphics Environment (SAGE) Controls: • 100 Megapixels Display • 55-Panel • 1/4 TeraFLOP • Driven by 30 Node Cluster of 64 bit Dual Opterons • 1/3 Terabit/sec I/O • 30 x 10GE interfaces • Linked to OptIPuter • 1/8 TB RAM • 60 TB Disk NSF LambdaVision MRI@UIC Source: Jason Leigh, Tom DeFanti, EVL@UIC OptIPuter Co-PIs
The UCSD OptIPuter Deployment UCSD is Prototyping a Campus-Scale OptIPuter 0.320 Tbps Backplane Bandwidth Juniper T320 20X 6.4 Tbps Backplane Bandwidth Chiaro Estara ½ Mile Campus Provided Dedicated Fibers Between Sites Linking Linux Clusters To CENIC SDSC SDSC SDSC Annex SDSCAnnex Preuss High School JSOE Engineering UCSD Has ~ 50 Labs With Clusters CRCA SOM Medicine 6thCollege Phys. Sci -Keck Collocation Node M Earth Sciences SIO Source: Phil Papadopoulos, SDSC; Greg Hidley, Calit2
The Campus Role is Rapidly Evolving: Indiana University-A Leading Edge Campus • The VP for Research & IT and CIO at Indiana U Has Established a Cyberinfrastructure Research Taskforce • Consists of ~ 25 Distinguished IU Faculty & Researchers • A Broad Array of Disciplines • Advise on Future Campus Research Cyberinfrastructure • Top Priority Large Amounts of Data “Parking Space” • Instruments In Their Labs That Can Generate GB/Min • Access to Remote Federated Repositories • Interactive Visualization of Supercomputer Datasets • 100-1000 TB Spinning Disk Managed Centrally • 1-10 Gb/s Network Connections to Labs Needed Source: Michael McRobbie, VP Research & IT, CIO Indiana University
UCSD Campus LambdaStore ArchitectureDedicated Lambdas to Labs Creates Campus LambdaGrid SIO Ocean Supercomputer Streaming Microscope IBM Storage Cluster Extreme Switch with 2 Ten Gbps Uplinks Source: Phil Papadopoulos, SDSC, Calit2
The Optical Network Can be Routed or Switched: The Optical Core of the UCSD Campus-Scale Testbed Goals by 2007: >= 50 endpoints at 10 GigE >= 32 Packet switched >= 32 Switched wavelengths >= 300 Connected endpoints Funded by NSF MRI Grant Approximately 0.5 TBit/s Arrive at the “Optical” Center of Campus Switching will be a Hybrid Combination of: Packet, Lambda, Circuit -- OOO and Packet Switches Already in Place Source: Phil Papadopoulos, SDSC, Calit2
The OptIPuter LambdaGrid is Rapidly Expanding StarLight Chicago UIC EVL U Amsterdam PNWGP Seattle NU NetherLight Amsterdam CAVEwave/NLR NASA Ames NASA Goddard NASA JPL NLR NLR 2 2 ISI 2 SDSU CENIC Los Angeles GigaPOP CalREN-XD 8 UCI CICESE CENIC/Abilene Shared Network UCSD 8 via CUDI CENIC San Diego GigaPOP 1 GE Lambda 10 GE Lambda Source: Greg Hidley, Aaron Chin, Calit2
The Cyberinfrastructure Conundrum: New Levels of Partnering, Planning, and Funding are Required • NSF Needs to Fund Hardening of Research Software / Systems • Regions and States Need to Fund Infrastructure to Link to National and International Systems • NLR, HOPI, GLIF • Proposed CENIC Statewide Summit on the Needs of High End Researchers • Campus CIO’s Need to Plan Jointly with Faculty Researchers • Faculty Need to Submit Infrastructure Grants • University Systems Need to Support Pathfinder Infrastructure • Only One CENIC Campus, UCSD, is Connected to HPR at 10Gbps • Both USC and UCLA Have Asked CENIC for 10Gb Pricing • The UC System Could be a Model for the Country (World?) An Example in Progress: Extending OptIPuter to UC Irvine
The OptIPuter is Primarily a Software Architecture Research Project –How to Harden and Support Users? DVC API DVC Runtime Library DVC Configuration DVC Services DVC Communication DVC Job Scheduling DVC Core Services Resource Identify/Acquire Namespace Management Security Management High Speed Communication Storage Services Globus XIO GSI RobuStore GRAM GTP XCP UDT CEP LambdaStream RBUDP Distributed Applications/ Web Services Visualization Telescience SAGE JuxtaView Data Services Vol-a-Tile LambdaRAM PIN/PDC
OptIPuter Uses Rocks for Software DistributionCampuses Should Support Standards-Based Cluster Software,So the Focus Can Turn to Cyberinfrastructure Integration 2004 Most Important Software Innovation HPCwire Reader's Choice and Editor’s Choice Awards Downloadable CDs Optional Components (rolls) OptIPuter Viz distribution Nearly 300 Rocks Clusters Around the World Active Discussion List (750+ people) Source: Phil Papadopoulos, SDSC
UCI is Adding Real Time Control to the Calit2 OptIPuter Testbed CalREN-XD x2 UCSD Storage & Rendering Cluster CalREN-HPR SPDS Cluster Chiaro Enstara Campus Backbone Microscope (NCMIR) 10 Gb 1 Gb HIPerWall UC Irvine • Application Development Experiments Requires Institutional Collaboration • An Experiment for Remote Access and Control within the UCI Campus • A Step Toward Preparation of an Experiment for Remote Access and Control of Electron Microscopes at UCSD-NCMIR UCI DREAM Lab Source: Steve Jenks, Kane Kim, Falko Kuester UCI
Purdue University Shadow Net -A Campus Dark Fiber Network Can Easily Support LambdaGrids Stewart Center Purdue Memorial Union Civil Engineering Computer Science Krannert Dual Core Campus Backbone • Primary Network • Gigabit between buildings • 10/100 to desktop • Gig E on demand Steven C. Beering Hall of Liberal Arts and Education Shadow Network Providing Load Balancing and Redundancy Math Birck Nanotechnology Center Collaborator “X” Commodity Internet, Internet 2, I-Light, NLR, etc. Example of Data Flowing through Shadow Network Another Example is Georgia Tech Source: Jim Bottum, CIO, Purdue U.
Calit2 Collaboration Rooms Testbed UCI to UCSD UCI VizClass Source: Falko Kuester, UCI & Mark Ellisman, UCSD UC Irvine UCSD NCMIR UC San Diego In 2005 Calit2 will Link Its Two Buildings via CENIC-XD Dedicated Fiber over 75 Miles Using OptIPuter Architecture to Create a Distributed Collaboration Laboratory
Multiple HD Streams Over Lambdas Will Radically Transform Campus Collaboration U. Washington JGN II Workshop Osaka, Japan Jan 2005 Telepresence Using Uncompressed 1.5 Gbps HDTV Streaming Over IP on Fiber Optics Prof. Smarr Prof. Prof. Aoyama Osaka Source: U Washington Research Channel
Calit2@UCI HiPerWall will be Linked by OptIPuter to Similar Walls at UCSD and UIC Source: Falko Kuester, UCI 100 Mpixels Funded by NSF MRI
Three Classes of LambdaGrid Applications • Browsing & Analysis of Multiple Large Remote Data Objects • Assimilating Data—Linking Supercomputers with Data Sets • Interacting with Coastal Observatories
Applying OptIPuter Technologies to Support Global Change Research • UCI Earth System Science Modeling Facility (ESMF) • NSF’s CISE Science and Engineering Informatics Program Funded ESMF and Calit2 to Improve Distributed Data Reduction & Analysis • Calit2 and UCI is Adding ESMF to the OptIPuter Testbed • Link to Calt2@UCI HiPerWall • Funding UCSD OptIPuter co-PI Phil Papadopoulos’ Team • ESMF Challenge: • Extend the NCO netCDF Operators Over Calit2 OptIPuter Testbed • Exploit MPI-Grid and OPeNDAP • Test DDRA on TBs of Data Stored Across the OptIPuter (at UCI and UCSD) and the Earth System Grid (LBNL, NCAR, and ORNL) • The Resulting Scientific Data Operator LambdaGrid Toolkit will Support the Next Intergovernmental Panel on Climate Change (IPCC) Assessment Report Source: Charlie Zender, UCI
Variations of the Earth Surface TemperatureOver One Thousand Years Source: Charlie Zender, UCI
Cumulative Earth Observing System Archive --Adding Several TBs per Day Source: Glenn Iona, EOSDIS Element Evolution Technical Working Group January 6-7, 2005
Challenge: Average Throughput of NASA Data Products to End User is Only < 50 Megabits/s Tested from GSFC-ICESAT January 2005 http://ensight.eos.nasa.gov/Missions/icesat/index.shtml
Interactive Retrieval and Hyperwall Display of Earth Sciences Images Using CENIC & NLR Enables Scientists To Perform Coordinated Studies Of Multiple Remote-Sensing Datasets Source: Milt Halem & Randall Jones, NASA GSFC & Maxine Brown, UIC EVL Eric Sokolowsky Earth Science Data Sets Created by GSFC's Scientific Visualization Studio were Retrieved Across the NLR in Real Time from OptIPuter Servers in Chicago and San Diego and from GSFC Servers in McLean, VA, and Displayed at the SC2004 in Pittsburgh http://esdcd.gsfc.nasa.gov/LNetphoto3.html
New OptIPuter Application Driver: Gigabit Fibers on the Ocean Floor LOOKING: (Laboratory for the Ocean Observatory Knowledge Integration Grid) www.neptune.washington.edu • LOOKING NSF ITR with PIs: • John Orcutt & Larry Smarr - UCSD • John Delaney & Ed Lazowska –UW • Mark Abbott – OSU • Collaborators at: • MBARI, WHOI, NCSA, UIC, CalPoly, UVic, CANARIE, Microsoft, NEPTUNE-Canarie • Goal: Prototype Cyberinfrastructure for NSF ORION LOOKING-- Integrate Instruments & Sensors (Real Time Data Sources) Into a LambdaGrid Computing Environment With Web Services Interfaces
MARS New Gen Cable Observatory Testbed - Capturing Real-Time Basic Environmental Data Central Lander MARS Installation Oct 2005 -Jan 2006 Tele-Operated Crawlers Source: Jim Bellingham, MBARI
LOOKING Builds on the Multi- Institutional SCCOOS Program, OptIPuter, and CENIC-XD Yellow—Initial LOOKING OptIPuter Backbone Over CENIC-XD Pilot Project Components • SCCOOS is Integrating: • Moorings • Ships • Autonomous Vehicles • Satellite Remote Sensing • Drifters • Long Range HF Radar • Near-Shore Waves/Currents (CDIP) • COAMPS Wind Model • Nested ROMS Models • Data Assimilation and Modeling • Data Systems www.cocmp.org www.sccoos.org/
Use OptIPuter to Couple Data Assimilation Models to Remote Data Sources and Analysis Goal is Real Time Local Digital Ocean Models Long Range HF Radar Regional Ocean Modeling System (ROMS) http://ourocean.jpl.nasa.gov/