Download
1 / 35
350 likes | 359 Views
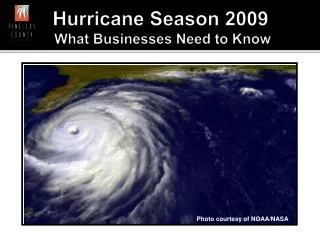
2009 Hurricane Season: Financing Catastrophe Risks Amid the Economic Crisis. Insurance Information Institute Webinar June 4, 2009 Download at: http://www.iii.org/media/presentations/2009hurricane/. Robert P. Hartwig, Ph.D., CPCU, President

E N D
2009 Hurricane Season:Financing Catastrophe Risks Amid the Economic Crisis Insurance Information Institute Webinar June 4, 2009 Download at: http://www.iii.org/media/presentations/2009hurricane/ Robert P. Hartwig, Ph.D., CPCU, President Insurance Information Institute 110 William Street New York, NY 10038 Tel: (212) 346-5520 bobh@iii.org www.iii.org
Presentation Outline • Top 10 Changes in Financing Catastrophe Loss Due to Crisis • US Catastrophe Loss Trends • Capital & Capacity • Financial Strength & Ratings • Critical Differences Between P/C Insurers and Banks • Investment Trends
Top 10 Changes in the Financing of Catastrophic Loss Capital Has Become Much More Scarce—But Markets Are Now Thawing Though still adequate, existing US p/c capital base shrank by 12.9% as of year-end 2008 Speed with which any given amount of capital can be raised has slowed Ability of banks to recently raise tens of billion in new capital is very encouraging Insurers should be able to do the same, if necessary Capital Has Become More Expensive Scarcity and volatility have driven cost of capital higher More competition on the open market for the limited amount of capital available Investment Earnings Can Offset Only a Smaller Share of Catastrophe Losses Low interest rates, poor equity market performance, write downs eat into returns Alternative Sources of Capital Dried-Up, But Are Beginning to Come Back E.g., hedge fund, private equity money is far less available Catastrophe Bonds: Are They Uncorrelated With Tradition Financial Market Risk? There was counterparty risk in arising from Lehman-backed guarantees Will result in changes in how such instruments are structured in terms of funding and investments held
Top 10 Changes in the Financing of Catastrophic Loss State Run Residual Markets Are More Vulnerable Due to Shaky Financing Arrangements FL’s situation is more precarious than ever & growing; Threatens state’s finances States using assessment mechanism as zero cost lines of credit (e.g., Texas) creating a high opportunity cost for insurers without fixing state’s fiscal exposure Economics of Start-Ups and Take-Out Companies in CAT Zones Becomes Less Compelling Due to Higher Cost of Capital Harder to raise cash Tougher to meet target ROI as cost of capital rises Financial Services Regulatory Overhaul Will Change How the Business of Insurance Is Regulated Unclear how this will affect how cat loss is financed Nat Cat legislation is not (currently) part of the overhaul discussion Systemic Risk Regulator: What are p/c systemic risk points? (Guaranty Funds?) Will be impacts on sources of capital as well (e.g., hedge funds) Federal Government is Fiscally Constrained Can/would federal play a bigger role in financing CAT risk? Fed backstops to be sought? Return on Investment for Mitigation is Greatly Increased Investments in mitigation provide a guaranteed high rate of return: up to 500% Mitigation preserves and conserves scarce private capital and government resources
Catastrophic Loss Catastrophe Losses Trends Are Trending Adversely
U.S. Insured Catastrophe Losses* $ Billions $100 Billion CAT year is coming soon 2008 CAT losses exceeded 2006/07 combined. 2005 was by far the worst year ever for insured catastrophe losses in the US, but the worst has yet to come. *Excludes $4B-$6b offshore energy losses from Hurricanes Katrina & Rita. **Based on PCS data through Dec. 31. PCS $2.1B loss of for Gustav. $10.655B for Ike of 12/05/08. Note: 2001 figure includes $20.3B for 9/11 losses reported through 12/31/01. Includes only business and personal property claims, business interruption and auto claims. Non-prop/BI losses = $12.2B. Source: Property Claims Service/ISO; Insurance Information Institute 6
Number of PCS Catastrophe Events, 1998-2008* The number of catastrophe events reached a 10-year high in 2008 *PCS defines a catastrophe as an even that caused at least $25 million in insured property damage and affects and significant number of policyholders and insurers. Source: PCS; Insurance Information Institute
States With Highest Insured Catastrophe Losses in 2008 In 2008, insurers paid $26 billion to 3.9 million victims of 37 major natural catastrophes across 40 states. 64% of the payouts (in $ terms) went to homeowners, 27% to business owners and 9% to vehicle owners Source: PCS; Insurance Information Institute.
Top 12 Most Costly Disasters in US History, (Insured Losses, $2007) 8 of the 10 most expensive hurricanes in US history have occurred in the past 5 years as have 9 of the 12 most expensive disasters of all types In 2008, Ike became the 6th most expensive insurance event and 4th most expensive hurricane in US history 9 *PCS estimate as of 12/15/08. Sources: ISO/PCS; AIR Worldwide, RMS, Eqecat; Insurance Information Institute inflation adjustments.
Inflation-Adjusted U.S. Insured Catastrophe Losses By Cause of Loss, 1988-2007¹ Insured disaster losses totaled $310.5 billion from 1988-2007 (in 2007 dollars) 46% of all US insured CAT losses between 1988 and 2007 were due to hurricanes and tropical storms 1 Catastrophes are all events causing direct insured losses to property of $25 million or more in 2007 dollars. Catastrophe threshold changed from $5 million to $25 million beginning in 1997. Adjusted for inflation by the III. 2 Excludes snow. 3 Includes hurricanes and tropical storms. 4 Includes other geologic events such as volcanic eruptions and other earth movement. 5 Does not include flood damage covered by the federally administered National Flood Insurance Program. 6 Includes wildland fires. Source: Insurance Services Office (ISO).
Capital/CapacityShrinkage, but Capital Levels are Within Historic Norms
U.S. Policyholder Surplus: 1975-2008* Actual capacity as of 12/31/08 was $455.6, down 12.0% from 12/31/07 at $517.9B, but still 60% above its 2002 trough. Recent peak was $521.8 as of 9/30/07. Surplus as of 12/31/08 is 12.7% below 2007 peak. $ Billions The premium-to-surplus ratio stood at $0.95:$1 at year end 2008, up from near record low of $0.85:$1 at year-end 2007 “Surplus” is a measure of underwriting capacity. It is analogous to “Owners Equity” or “Net Worth” in non-insurance organizations 12 Source: A.M. Best, ISO, Insurance Information Institute. *As of 12/31/08
Policyholder Surplus, 2006:Q4 – 2008:Q4 Capacity peaked at $521.8 as of 9/30/07 Declines Since 2007:Q3 Peak Q2: -$16.6B (-3.2%) Q3: -$43.3B (-8.3%) Q4: -$66.2 (-12.9%) 13 Source: ISO.
Premium-to-Surplus Ratios Before Major Capital Events* P/C insurance industry was better capitalized going into the financial crisis than before any “capital event” in recent history *Ratio is for end of quarter immediately prior to event. Date shown is end of quarter prior to event. **Latest available Source: PCS; Insurance Information Institute.
U.S. P/C Industry Premiums-to-Surplus Ratio: 1985-2008 Premiums measure risk accepted; surplus is funds beyond reserves to pay unexpected losses. The larger surplus is in relation to premiums—the lower the ratio of premiums to surplus—the greater the industry’s capacity to handle the risk it has accepted. P/C insurers remain well capitalized despite recent erosion of capital. 50-year average = 1.52. 19980.84:1–the lowest (strongest) P:S ratio in recent history. 0.95:1 as of 12/31/08 Sources: A.M. Best, ISO, Insurance Information Institute.
Ratio of Insured Loss to Surplus for Largest Capital Events Since 1989* The financial crisis now ranks as the 2nd largest “capital event” over the past 20+ years *Ratio is for end-of-quarter surplus immediately prior to event. Date shown is end of quarter prior to event. **Latest available Source: PCS; Insurance Information Institute.
Historically, Hard Markets Follow When Surplus “Growth” is Negative Sharp decline in capacity is a necessary but not sufficient condition for a true hard market Sources: A.M. Best, ISO, Insurance Information Institute
Capital Raising by Class Within 15 Months of Katrina, Rita,Wilma $ Billions $33.7B in capital was raised in the wake of Katrina, Rita, Wilma Nearly 2/3 of capital raised post-Katrina was from non-traditional sources—but could similar sums be raised in 2009? Source: Lane Financial Trade Notes, January 31, 2007.
New Funds Contributing to US Policyholder Surplus, 2005-2008 Despite crisis, p/c insurers still attracted $11.2 billion in new capital in 2008 *Through Q4 2009 (latest available). Source: ISO; Insurance Information Institute
FINANCIAL STRENGTH & RATINGSIndustry Has Weathered the Storms Well
P/C Insurer Impairments,1969-2008 The number of impairments varies significantly over the p/c insurance cycle, with peaks occurring well into hard markets Source: A.M. Best; Insurance Information Institute
P/C Impairment Frequency vs. Catastrophe Points in Combined Ratio, 1977-2008 Impairment rates are not strongly correlated with catastrophe activity 2008 impairment rate was a record low 0.23%, second only to the 0.17% record low in 2007 and barely one-fourth the 0.82% average since 1969 Source: A.M. Best, PCS; Insurance Information Institute
P/C Insurer Impairment Frequency vs. Combined Ratio, 1969-2008 Impairment rates are highly correlated with underwriting performance and reached record lows in 2007/08 2008 impairment rate was a record low 0.23%, second only to the 0.17% record low in 2007 and barely one-fourth the 0.82% average since 1969 Source: A.M. Best; Insurance Information Institute
Number of Impairments by State, 1969-2008 TX, FL and CA have the largest number of impairments. Catastrophe risk plays a role but mainly for very small and undiversified insurers. Other factors influencing impairments include the political environment and business mix Source: A.M. Best; Insurance Information Institute
Frequency of Impairments by State, 1969-2008 (Impairments per 100 Insurers Domiciled in State) WY, LA, FL have the highest impairment rates in the country National average = 0.82% Source: A.M. Best; Insurance Information Institute
Summary of A.M. Best’s P/C Insurer Ratings Actions in 2008* P/C insurance is by design a resilient in business. The dual threat of financial disasters and catastrophic losses are anticipated in the industry’s risk management strategy. Despite financial market turmoil, high cat losses and a soft market in 2008, 81% of ratings actions by A.M. Best were affirmations; just 3.8% were downgrades and 4.0% upgrades *Through December 19. Source: A.M. Best. 26
Historical Ratings Distribution,US P/C Insurers, 2008 vs. 2005 and 2000 2000 2008 2005 A++/A+ and A/A- gains P/C insurer financial strength has improved since 2005 despite financial crisis Source: A.M. Best: Rating Downgrades Slowed but Outpaced Upgrades for Fourth Consecutive Year, Special Report,November 8, 2004 for 2000; 2006 and 2009 Review & Preview. *Ratings ‘B’ and lower.
Reasons for US P/C Insurer Impairments, 1969-2008 Deficient loss reserves and inadequate pricing are the leading cause of insurer impairments, underscoring the importance of discipline. Investment and catastrophe losses play a much smaller role. Source: A.M. Best: 1969-2008 Impairment Review, Special Report,Apr. 6, 2008
Critical Differences Between P/C Insurers and BanksSuperior Risk Management Model & Low Leverage Makea Big Difference
How Insurance Industry Stability Has Benefitted Consumers BOTTOM LINE: Insurance Markets—Unlike Banking—Are Operating Normally The Basic Function of Insurance—the Orderly Transfer of Risk from Client to Insurer—Continues Uninterrupted This Means that Insurers Continue to: Pay claims (whereas 61 banks have gone under as of 5/31) The Promise is Being Fulfilled Renew existing policies (banks are reducing and eliminating lines of credit) Write new policies (banks are turning away people who want or need to borrow) Develop new products (banks are scaling back the products they offer) 30 Source: Insurance Information Institute
Emphasis on Underwriting Matching of risk to price (via experience and modeling) Limiting of potential loss exposure Some banks sought to maximize volume and fees and disregarded risk Strong Relationship Between Underwriting and Risk Bearing Insurers always maintain a stake in the business they underwrite, keeping “skin in the game” at all times Banks and investment banks package up and securitize, severing the link between risk underwriting and risk bearing, with (predictably) disastrous consequences—straightforward moral hazard problem from Econ 101 Low Leverage Insurers do not rely on borrowed money to underwrite insurance or pay claimsThere is no credit or liquidity crisis in the insurance industry Conservative Investment Philosophy High quality portfolio that is relatively less volatile and more liquid Comprehensive Regulation of Insurance Operations The business of insurance remained comprehensively regulated whereas a separate banking system had evolved largely outside the auspices and understanding of regulators (e.g., hedge funds, private equity, complex securitized instruments, credit derivatives—CDS’s) Greater Transparency Insurance companies are an open book to regulators and the public Reasons Why P/C Insurers Have Fewer Problems Than Banks: A Superior Risk Management Model 31 Source: Insurance Information Institute
Investment Performance Investments are the Principle Source of Declining Profitability
Property/Casualty Insurance Industry Investment Gain:1994- 20081 Investment gains fell by 51% in 2008 due to lower yields, poor equity market conditions 1Investment gains consist primarily of interest, stock dividends and realized capital gains and losses. 2006 figure consists of $52.3B net investment income and $3.4B realized investment gain. *2005 figure includes special one-time dividend of $3.2B. Sources: ISO; Insurance Information Institute. 33
Treasury Yield Curves: Pre-Crisis vs. Current* Treasury Yield Curve is at its most depressed level in at least 45 years. Investment income will fall as a result. Stock dividend cuts will further pressure investment income *May 2009. Sources: Federal Reserve; Insurance Information Institute.
Insurance Information Institute On-Line WWW.III.ORG THANK YOU FOR YOUR TIME AND YOUR ATTENTION! Download at: http://www.iii.org/media/presentations/2009hurricane/