Download
1 / 40
400 likes | 502 Views
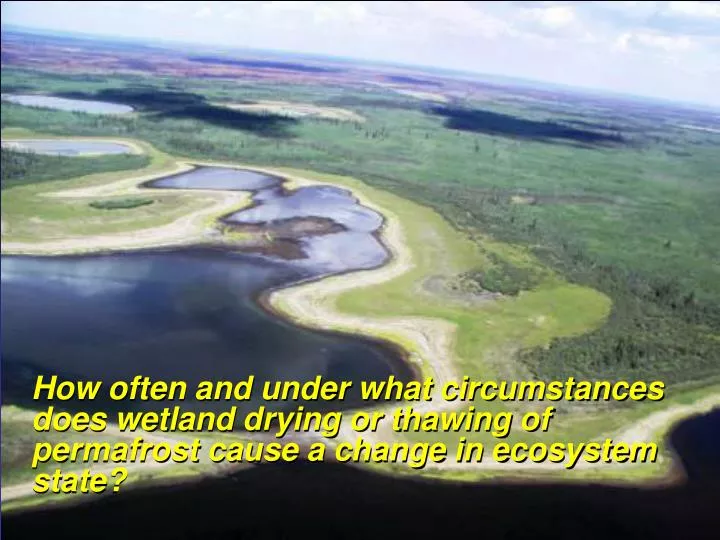
How often and under what circumstances does wetland drying or thawing of permafrost cause a change in ecosystem state?. Crossing the final ecological threshold in high Arctic ponds. Smol and Douglas 2007 PNAS. Barber et al. 2004 Climatic Change. Klein et al. Can. J. For. Res. 2005.

E N D
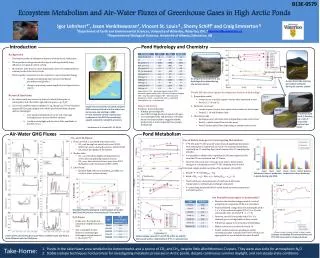
How often and under what circumstances does wetland drying or thawing of permafrost cause a change in ecosystem state?
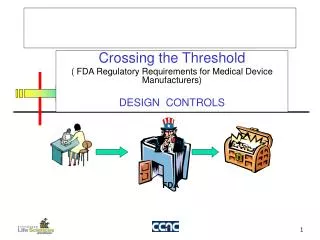
Crossing the final ecological threshold in high Arctic ponds Smol and Douglas 2007PNAS
Yoshikawa and Hinzman 2003 Permafrost and Periglac. Process.
Consequences of a changing hydroclimate for organic-rich wetlands CZEN
Climate Plant fixation and allocation Microbial metabolism Peat accumulation
APEX Gradient sites Black Spruce Willow/Bog Birch Tussock Grass Emergent Rich fen
www.apex.msu.edu Control Lowered Raised
-10 -5 0 5 10 15 0 500 1000 1500 2000 www.apex.msu.edu Light response curves Raised Control NEE (mol m-2 s-1) Lowered PAR (mol m-2 s-1)
www.apex.msu.edu • ET & plant responses to water table treatments
Raised 400 Control Lowered 300 200 CH4 flux (mg m-2 d-1) 100 0 -70 -60 -50 -40 -30 -20 -10 0 10 Mean daily WT position (cm) Coupled carbon – water dynamics • CH4 flux sensitive to soil hydroclimate (Treat et al. in review) a 8 warming 7 no warming b 6 c 5 cd mol CH4 m-2 min-1 d 4 e 3 2 1 0 Control Lowered Raised
450 400 350 300 Annual organic matter storage (g organic matter m-2 yr-1) 250 200 150 100 0 50 100 150 200 250 Time since permafrost degradation Turetsky et al. 2006
Methane Fluxes, 2003 1.0 Permafrost Plateau Thermokarst Edges 0.8 Thermokarst Wetlands 0.6 mmol CH4 m-2 hr-1 0.4 0.2 0.0 -0.2 3/20 4/9 4/29 5/19 6/8 6/28 7/18 8/7 8/27 9/16 10/6 *Each point is the mean ± one standard deviation of one to five measurements. Measurements on 3/25 were made in 2004. Wickland et al., 2006
Water table position (cm) 0 0 0 0 - - - - 5 5 5 5 - - - - 10 10 10 10 - - - - 15 15 15 15 - - - - 20 20 20 20 - - - - 25 25 25 25 - - - - 30 30 30 30 - - - - 35 35 35 35 - - - - 40 40 40 40 1.0 1.0 1.0 0.9 0.9 0.9 0.9 Sphagnum poor fen, QB 0.8 0.8 0.8 0.8 0.7 0.7 0.7 0.7 0.6 Storage Coefficient 0.5 0.5 0.5 0.5 0.4 0.4 0.4 0.4 0.3 0.3 0.3 0.3 0.2 0.2 0.2 0.2 0.1 0.1 0.1 0.1 Brown moss rich fen, AK 0.0 0.0 0.0 0.0 Pristine Drained Wetland ecohydrology can be surprising • Vegetation -> peat properties -> hydrology Flashier!