Download
1 / 18
180 likes | 417 Views
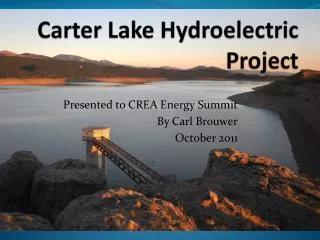
Aquifer Test Analysis Carter Lake, Iowa. Luca DeAngelis, P.E., P.G. Hydrologist Layne Western. Introduction. The community of Carter Lake plans to pump groundwater from an alluvial aquifer to maintain a desired level of a lake near Kiwanis Park.

E N D
Aquifer Test AnalysisCarter Lake, Iowa Luca DeAngelis, P.E., P.G. Hydrologist Layne Western
Introduction • The community of Carter Lake plans to pump groundwater from an alluvial aquifer to maintain a desired level of a lake near Kiwanis Park. • Layne Christensen Company (Layne) was retained by Carter Lake to estimate percentage of water from current production well that is obtained from induced infiltration from lake. • Objective: • Estimate distance from lake for future wells that will be least affected by infiltration from the lake
Outline General Carter Lake Water Balance Layne Activities Conclusions
Water Balance Streamflow (Qi) Equation Form:
Water Balance • Inflows • Stream flow into lake = 0 • Mean annual precipitation = 31 inches (precip onto lake) • Runoff – Drains an area of 1,930 acres • Groundwater flux into = ? • Outflows • Groundwater flux out = ? • Lake evaporation = 40 inches per year • Overall balance • Runoff – function of precip – USGS** (5 in/year) • Groundwater flux = -220 acre feet* (72 million gallons) • Loss to lake evap = -1,082 acre feet* (300 million gallons) • from USACE 84 - 85 study • ** USGS publication (1951-1980 data)
Layne Field Activities Rehabilitation of the existing production well. Installation of three (3), two (2) inch diameter observation wells. Implementation of a seven (7) day aquifer test.
Aerial photograph Carter Lake, Iowa showing Carter lake and location of production well.
Site Geology 0 – 7 feet – Silty clay 7 – 15 feet – Fine sand 15 – 20 feet – Blue clay 20 – 43 feet – Fine sand 43 – 58 feet – Gravel and coarse sand 58 – 60 feet – Blue clay (confining unit) 60 – 93 feet – Fine to coarse sand, with some small gravel 93 feet – Bedrock (Limestone). Depth to water was measured in the test well and the observation wells at approximately 15 feet below ground surface (bgs). Depth to water was consistent thought the Site.
Pump Test Pump Well 82-1 at rate of 1,070 gpm Pumped continuously for 7 days Monitored water levels in wells (pump and observation) Used pressure transducers and manual measurements
Analytical Methods • Cooper-Jacob (1946) distance drawdown/time drawdown method. This method is applicable for confined or unconfined aquifers and was developed with the following assumptions: • The aquifer is confined; • The aquifer has a seemingly infinite areal extent; • The aquifer is homogeneous, isotropic, and of uniform thickness over the area influenced by the test; • Prior to pumping, the potentiometric surface of the aquifer is nearly horizontal; • The aquifer is pumped at a constant discharge rate; • The well penetrates the entire thickness of the aquifer and receives water by horizontal flow; and • Drawdown data is corrected for the dewatering of the aquifer (unconfined systems only).
Aquifer Test Analysis Results Pumping rate 1,070 gallons per minute Transmissivity 21,500 square feet per day Hydraulic conductivity 715 feet per day Storativity coefficient .001 Distance to source of recharge 400 feet Percentage of water derived from source of recharge 45 percent
Aerial photograph of Carter lake indicating wells and calculated recharge boundary.
Conclusions • Using USACE numbers – lake needs to add 400 million gallons per year of water to maintain level (runoff or supplemental pumping) • Existing production well estimated to be at 400 feet from a source of recharge boundary (lake). • Current pumping at existing production well results in induced infiltration from lake of 45% • New wells should be located further south of existing well at a greater distance from lake to reduce infiltration of lake water resulting in increased recharge of lake. • + 200 feet south Induced infiltration 30% • +400 feet south Induced infiltration 15%