Download
1 / 32
320 likes | 450 Views
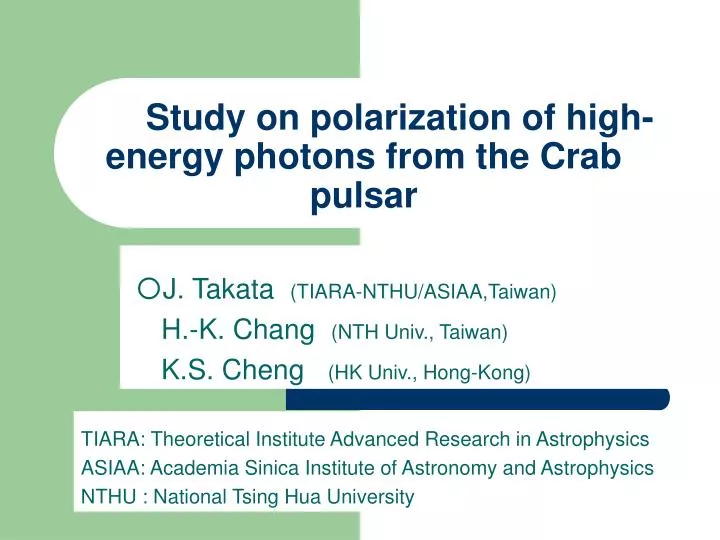
Study on polarization of high-energy photons from the Crab pulsar. 〇 J. Takata (TIARA-NTHU/ASIAA,Taiwan) H.-K. Chang (NTH Univ., Taiwan) K.S. Cheng (HK Univ., Hong-Kong). TIARA: Theoretical Institute Advanced Research in Astrophysics

E N D
Study on polarization of high-energy photons from the Crab pulsar 〇J. Takata (TIARA-NTHU/ASIAA,Taiwan) H.-K. Chang (NTH Univ., Taiwan) K.S. Cheng (HK Univ., Hong-Kong) TIARA: Theoretical Institute Advanced Research in Astrophysics ASIAA: Academia Sinica Institute of Astronomy and Astrophysics NTHU : National Tsing Hua University
Contents • Introduction • Synchrotron model for the Crab pulsar • Results • Discussion • Summary & Conclusion
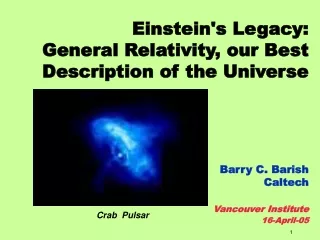
Vela Crab 1, Introduction; Gamma-ray pulsar Where and how are the particles accelerated and the gamma-rays radiated in the pulsar magnetosphere?
1, Introduction Gamma-ray emission models • Pulsar as a huge electric dynamo • Particle acceleration ( ) via electric field (E||) parallel to magnetic field line in gap, where • Gamma-ray emissions (~a few GeV) via curvature process Last open line
Polar cap Caustic Outer gap 1, Introduction Polar cap Double peak light curve Viewing angle Outer gap & Caustic Emission direction =particle motion direction -aberration -time delay Rotation phase
1, Introduction Why polarization? • Polarization data will play an important role to discriminate the various models • Polarization measurement will increase (2 times) number of observed parameter; polarization position angle (P.A.) swing and polarization degree (P.D.) • So far, Crab optical data is available. In future, Compton telescope will measure in MeV-bands for the Crab pulse.
40% 40% Kanbach et al 2004 Smith et al 1988 1, Introduction Crab optical data Intensity • Observation -fast swing P.A. through peaks -constant P.A. in off-pulse phase -min. in P.D. at both peaks -~40% of max. in P.D. bridge off pulse Position angle (P.A.) Polarization degree (P.D.)
Expected Synchrotron phase-ave. spec. 1eV 1MeV 2,previous studies Cheng, Ruderman & Zhang (2000) model for Crab pulsar • Synchrotron and inverse-Compton process of secondary pair produces photons in wide energy bands (optical to GeV). S.R. C.R. Outer gap We examine the polarization characteristics predicted by the synchrotron model
observer *Synchrotron radiation Projected B on the skey 3 polarizations • Polarization characteristics are described by Stokes parameters, I, Q, U,V • -Linearly Degree of polarization • -Position angle of polarization plane
3 Synchrotron emission model • Emission direction (particle motion direction) =edge of cone with • Acceleration • Observed electric vector of EM wave with aberration effect gyration
3,synchrotron model Model; Stokes parameters • At each point and at each radiation….. 1, linearly polarized radiation at 2,Stokes parameters 3, Intensity (projected rotation axis on the sky)
Viewing angle 90 Phase • Collecting of photons • Observed P.D. and P.A. after collecting photons Fig. Emission position projected on plane for the outer gap model
Fig., predicted Crab spectrum by KS2000 Emissivity & model parameters Model,Outer gap model- Cheng, Ruderman & Zhang (2000) -Emission region starting from null charge surface • Model parameters • Emission region is upper surface of the gap
4,Results; Outer gap model 300eV 100keV 1eV • Fast P.A. swing at both peaks and in bridge phase. • Maximum in P.D. (~60%) near both peaks 40° P.A. A 0 -40° 60% P.D. 10% 1.5 phase
Maximum in P.D. near the peaks P1 P2 P.A. 80 A P.D. 80
4, Results; Crab data .Vs. model results *Model explains observed features of 1, Fast swing at both peaks, 2, relatively constant at bridge 4, relatively small P.D. But, it is difficult to explain 1,pattern of P.D. 2,off pulse emission P.A. 40% P.D. 60% 1.5 phase
5, Discussion What the observation indicates? • Observation may indicate that present model is very simple…. 1, gap geometry -outer gap will extending inside of the null surface 2, only outward emission by the outgoing particles , -inward emission via ingoing particles may be observed 3, constant power low index (p=2) of particle distribution, -more realistic particle distribution may be important, 4 rotating dipole field? • Crab optical data will reflect more detail structure of pulsar magnetosphere.
No currents ! 0.3 Bound. of vacuum gap (ρ=0) Jmax=0.4 5, Discussion; Outer gap geometry • In fact, outer gap will start from insider of the null charge surface Jmax=0.3 0.2 Height null surface Current Radius in units of light radius Takata et al. (2004, 2006)
5, Discussion; Modified emission map 90° Outward emission Inward emission
Vacuum gap Jmax=0.3 Field-aligned electric fields Jmax=0.4 null surface Distance along field line in units of light radius 5, Discussion; Electric field
5, Discussion; Expected light curve Outward emission 90° Inward emission
6,Summary • The polarization characteristics by the synchrotron emission, which is favor for Crab spectrum, were calculated with traditional outer gap model. -Model explains observed small value of P.D. and the constant of P.A. at bridge -Predicted pattern of P.D. is problematic. • None of the present models was able to explain both of P.A. and P.D. for Crab optical data. • The light curves with the outer gap starting from near the stellar surface have multi peaks.
B P.A. at bridge / off pulse phase Ω
0 deg 90 deg 270 deg Rotating dipole field Dipole field P.A. 0.1
Synchrotron radiation Curvature radiation Outer gap Caustic model Which one more similar to observation?
Polar cap Caustic Outer gap Gamma-ray emission models
Projected B on the skey Projected B on the skey 3 polarizations of Curvature Vs. Synchrotron * Curvature radiation *Synchrotron radiation
Fig., predicted Crab spectrum by KS2000 Emissivity & model parameters Model1,Outer gap model- Cheng, Ruderman & Zhang (2000) -Emission region starting from null charge surface Model 2,Caustic model -emission region starting from stellar surface -constant emissivisity • Model parameters • Emission region is upper surface of the gap
4, Results; Caustic model • Caustic model explains off pulse emission of Crab pulsar 1,Maximum in P.D. (~15%) at peak or trailing of peaks 2,P.A. at off pulse… -relatively constant -similar value with bridge phase bridge Off pulse P.A. A 0 15% P.D.
Outer gap Caustic Polar cap Data 40% 80% 2,previous studies Previous studies (Dyks et al. 2004) • Curvature emission model predicts -high Polarization degree (P.D) -large P.A. swing at off-pulse phase Intensity Position angle (P.A.) • There are no curvature emission model for the Crab spectrum Polarization degree (P.D.)
Observed polarization planewith aberration effect * No aberration effect * With aberration effect