Download
1 / 17
170 likes | 502 Views
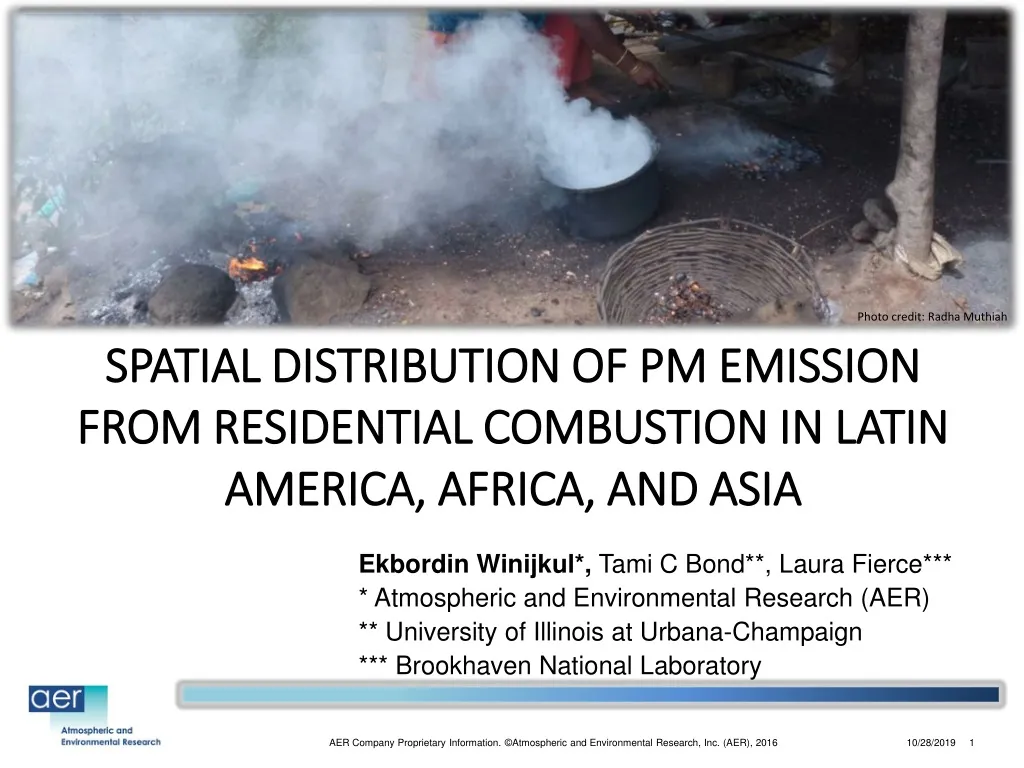
Photo credit: Radha Muthiah. SPATIAL DISTRIBUTION OF PM EMISSION FROM RESIDENTIAL COMBUSTION IN LATIN AMERICA, AFRICA, AND ASIA. Ekbordin Winijkul*, Tami C Bond**, Laura Fierce*** * Atmospheric and Environmental Research (AER ) ** University of Illinois at Urbana-Champaign

E N D
Photo credit: RadhaMuthiah SPATIAL DISTRIBUTION OF PM EMISSION FROM RESIDENTIAL COMBUSTION IN LATIN AMERICA, AFRICA, AND ASIA Ekbordin Winijkul*, Tami C Bond**, Laura Fierce*** * Atmospheric and Environmental Research (AER) ** University of Illinois at Urbana-Champaign *** Brookhaven National Laboratory
Residential Emission & Key Problems • Residential Sector • Account for 44% of global energy consumption (all fuels) in 2010 [IEA, 2012] • Significant combustion source of PM, BC, OC, CO, CO2, and HC on a global scale [Bond et al., 2004; EDGAR, 2014] • Current emission inventories of residential sector • Based on simple calculation • Fuel consumption x Emission Factors of Stoves • Not consider end-use: cooking, heating • Spatial distribution of emission based on population and urban/rural at most, not consider availability of fuels in the area. • Future projection: assume 100% replacement of fuels which is hardly possible
Study Objectives • Estimate Potential Reduction in Residential Emission • Provide spatial distribution of residential fuel, population, and end-use that aids in spatially distributed residential emission. • Provide estimation of more realistic emission reductions from different policy options. • Study area: 128 countries in Asia, Africa, and Latin America (92% of global biomass consumption in residential sector)
Global GIS Maps Urban Land Types Source: CIESIN [2004] Night Light Map – Electrified Land Types All maps with cells 2.5 arc-min on each side (5 km at equator) Source: NOAA-NGDC [2014] Forest Access Land Types Source: EC [2003]
Spatial Distribution of Population & Resource • Matching population with resources availability in 5 land types • Step A & B: • Access to electricity: • Urban • Electrified rural • Non-electrified rural • Step C: • Access to fuelwood • Forest Access Area (FAA) • Non-FAA • Major Assumptions: • Free fuels • Fuelwood in FAA • All agricultural waste and dung
Spatial Distribution of Land Types • Large portions of the world are classified as non-electrified (grey and green) • Large clusters of electrified land types in East Asia, South Asia, and Latin America • The green land types are areas where wood is available but electricity is not, and wood is likely to become the main fuel • Gray areas indicate energy poverty: lack both electricity and readily available wood UNF = Urban with non-forest access, ERNF = Electrified Rural with Non-Forest Access, ERFA = Electrified Rural with Forest Access, NRNF = Non-electrified Rural with Non-Forest Access, NRFA = Non-electrified Rural with Forest Access
Distribution of National Fuel Consumption (1) • Energy Consumption from IEA [2012] • National level • Fuel Types • Consumption • Estimated Per-capita Energy Consumption in 4 end-uses • Cooking: literature review • Lighting: literature review • Heating: linear relationship between energy consumption and heating degree days • Others
Distribution of National Fuel Consumption (2) Spatial Distribution of fuel use • Previous inventories • Select only clean fuels to distribute in urban area • This inventory • Step 1: Distribute fuelwood to forest access area • Step 2: Distribute others & remaining fuelwood by efficiencies • Urban • Electrified rural • Non-electrified rural
Emission Calculation • Emission Calculation • Assume all stoves are traditional stoves (baseline) j = end-uses k = fuels • Emis emission in grams • P is the population • fj,kis the fraction of population for whom fuel k supplies end-use j • UEjis the per-capita useful energy in MJ required for end-use j • ƞj,kis the thermal efficiency of the device used • LHVk is the lower heating value of fuel k in MJ (kg fuel)-1 • EFj,k are measured in grams of pollutant per kilogram of fuel burned The term in brackets gives the mass of fuel k used by one person for end-use j
Emission Characteristics in Five Land Types Per capita PM Emission in 5 land types PM Emission in 5 land types TOTAL • Per-capita emission depends on fuel use • Africa -> highest solid biomass use -> highest per-capita emission • East Asia -> high coal -> high per-capita emission • Latin America -> high LPG -> low per-capita emission • Urban and electrified rural with non-FAA -> using high efficiency fuels -> lower per-capita emission • Two non-electrified rural land types -> using lowest quality fuels in each country -> highest emission per-capita
Spatial Distribution of Emission • Developed based on stove types and spatial distribution of population and resources in 5 land types • High emission in areas that have both high population and forest access • The east coast of China, part of India, main island of Indonesia, and some areas in Africa • Lower emission are mostly electrified with non-FAA with lower population.
Emission Reduction Scenarios (1) • Scenario 1: Cleanest Current Stove Scenario • Same spatial distribution of fuels as baseline • Use cleanest stoves in each land types instead of traditional stoves • Commercially available & broad acceptability demonstrated Example of stove improvement (Note: the choice differs by fuel and land type) E = 16%, PM = 8g/kg E = 40%, PM = 0.5g/kg E = 30%, PM = 4g/kg Three-stone fire (Traditional stove: baseline scenario) Philips Fan Stove (Improved stove with fan: electrified land types) Rocket Stove (Improved stove: non-electrified land types)
Emission Reduction Scenarios (2) • Scenario 2: Fuel Switching Scenario • Users adopt the cleanest possible fuels • Switching to electricity in electrified areas and LPG in non-electrified areas • No switching for free fuels (fuelwood in FAA & agricultural waste and dung) • Use traditional stoves for new fuels Example of fuel switching (Note: the choice differs by fuel and land type) Three-stone fire (Traditional stove: baseline scenario) E = 75%, PM = 0g/kg Electric stove (electrified land types) E = 16%, PM = 8g/kg E = 55%, PM = 0.4g/kg LPG stove (non-electrified land types)
Global Emission Reduction Scenarios Current cleanest stove and Fuel Switching scenarios • Scenario 1: Cleaner stove (red line) -- higher reduction in forest access land • Especially in the electrified land types where improved stoves with fan can be used • Overall PM reduction of 72% • Scenario 2: Fuel switching (green line) -- higher reduction in non-forest access land • Users do not have access to free fuels and assumed to be more willing to switch to cleaner fuels • Users are not adopting cleaner fuels if they have forest access • Overall PM reduction of 25% Land Types URB= Urban ERNF = Electrified Rural with Non-Forest Access ERFA = Electrified Rural with Forest Access NRNF = Non-electrified Rural with Non-Forest Access NRFA = Non-electrified Rural with Forest Access
Conclusion & Availability • Developed method to distribute national-level fuel consumption among 5 land types and 4 major end-uses for Asia, Africa, and Latin America • Estimated emission reduction from 2 mitigation scenarios • Scenario 1: Cleaner Stove provides higher reduction & highest reduction in electrified forest access area • Scenario 2: Cleaner Fuel has negligible reduction in forest access area due to assumption of free fuels • Current Inventory: Gridded emission of 5km x 5km is available for Asia, Africa, and Latin America • PM, BC, OC, NOx, CO, CO2, CH4, NMHC • Base year 2010
Acknowledgements • Bond research group, University of Illinois at Urbana-Champaign • Clean Air Task Force • USEPA
Photo credit: http://bluesource.com/Efficient-Cook-Stoves Thank you for your attention ewinijkul@aer.com Questions