Download
1 / 47
490 likes | 654 Views
Cost of Capital. Goal of Financial Management:. Maximize the value of the firm as determined by: the present value of its expected cash flows , discounted back at a rate that reflects both the riskiness of the firms projects and the financing mix used to fund the projects.

E N D
Goal of Financial Management: Maximize the value of the firm as determined by: the present value of its expected cash flows, discounted back at a rate that reflects both the riskiness of the firms projects and the financing mixused to fund the projects. Cost of capital – the interest rate used to determine the cost of raising new funds.
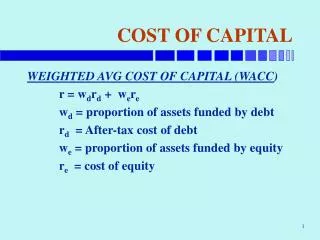
Cost of Capital • Weighted average measure of the returns required by the providers of capital (debt, preferred stock, common stock) to the firm. • The return required by the providers of capital is based upon the risk (an opportunity cost) • The weight corresponds to the amount of financing (financing mix) that comes from each source, which also influences the required return.
Cost of Capital • Issues to be addressed: • How is the cost of each type of financing measured? • How is the portion of each type of financing measured (the weights of each type of financing)? • The difference between the firm cost of capital and project cost of capital.
Cost of Capital as a Hurdle Rate • The cost of capital represents an opportunity cost. The firm must choose between different projects. Any project undertaken should provide a return to the providers of the capital at least equal to that of projects of similar risk. • Therefore it represents the minimum a new project should earn --- it is the Hurdle Rate
Relationship with Past Classes • Rate of Return Rule • Accept projects with a rate of return greater than the opportunity cost of capital • NPV Rule • Accept investments that have a positive net present value and reject projects that have a negative net present value • TVM Relationships • By minimizing the cost of capital the firm can increase the PV of its projects and the value of the firm
Role in Decision MakingAn Example • Building a nuclear power plant is more expensive than coal, however producing electricity in the future is cheaper. • Ignoring any ethical questions – and given the future cash flows of each which should a Utility firm invest in? • Timing and Size of Cash Flows Nuclear -- High initial cost, lower costs later Coal -- Low initial cost, higher costs later
Intuitive Answer • If the cost of capital is “low” nuclear power is less expensive. • If the cost of capital is “high” coal generated power is less expensive. • Why did it depend on the cost of capital? • The timing and size of the cash flows matter. The PV of the higher future costs decrease as the rate increases.
Weighted Average Cost of CapitalWACC • The company cost of capital represents a weighted average of all of the return required by the holders of the firm’s existing securities. • The return represents the average amount of compensation suppliers of capital are demanding in return for accepting the risk associated with the firm as a whole.
Capital Structure and Cost of CapitalIntroduction • The company cost of capital should reflect the return that is consistent with the risk of the firms assets, rassets • This assume that the market value of the firm’s debt and equity equals the market value of its assets. • The company cost of capital is just a weighted average of the return on each type of financing.
Company Cost of CapitalA Simple Example: Debt and Equity • Note: • The value of debt and equity are market values • This is the opportunity cost of capital for the existing assets of the firm • This should be used to value a new project ONLY IF the project has the same risk as the firm’s assets
Costs of Financing • The firm may actually have additional sources of financing, not just basic debt and equity. • The most common form of this is preferred stock which should also be included in the calculation if it exists • Other hybrid forms of financing are also possible, if they account for a significant portion of financing, they should also be included.
Components of the Company Cost of Capital • Cost of New Debt • The return that must be paid to new bondholders • Cost of Preferred Stock • The return required by purchasers of preferred equity • Cost of Common Equity • The return required by purchasers of common equity
Weighted Average Cost of Capital (or Company Cost of Capital) • WACC = wd(1-t)rd + wPSrPS+were • rd = cost of debt estimated by the YTM of existing debt • rPS =cost of preferred stock=D/(P-Flotation) • re = cost of common equity (retained earn) • DCF re=D1/P + g • CAPM re= rRF + B(rM - rRF) • Bond + re = rd+ Risk Premium
Issues in Estimating the Cost of Capital • Calculation of each of the costs of financing • Calculation of the weights associated with each of the costs of financing.
Calculating Cost of Debt • We previously showed the relationship between the riskiness of debt and the bond rating. • Best case – easily observed bond prices and efficient markets • More Common - Using the bond rating and the associated yield (default) spread it is possible to estimate the cost of debt.
Calculating the Cost of Debt • The Value of a bond is equal to the PV of the future cash flows it generates. The types of cash flows are its coupon payments and par value at maturity. • Let C be the future coupon payments and MV be the par value returned at maturity
Price and Value • Assuming that the market is providing an “efficient” price (it represents the risk of default and other components of the yield spread and is traded frequently), the market price, coupon payments, and par value can all be used to estimate the yield to maturity (rd) which is an approximation of the cost of debt.
Example • Assume that Bulldog Inc has one bond outstanding. It has a 6% coupon payment, makes semiannual coupon payments, matures in 20 years, and is currently selling for $101.50 for each $100 in par value rd =5.8% per year (or 2.9% each 6 months)
Intuition • If it outstanding bonds are paying a return of 5.8%, why would you buy a bond with identical risk (same chance of default) paying less? • The firm would also have no reason to pay more unless the risk was changing -- If it is increasing it will also be soon reflected in the outstanding bonds YTM...
Real World Problems • Most firms have a variety of debt, each with a separate coupon and maturity. • If all of the debt can be identified and a market price can be found, then the cost of debt is the weighted average of the different yield to maturities (weight based upon par value of each type of debt). • However, bond prices are not as easy to identify as equity prices.
Estimates of Cost of Debt • Using bond ratings • The cost of capital should be long-term, it is a long-term hurdle rate for new projects – so basing an estimate off of a long-term risk free rate and the yield spread associated with its rating provide an easy adjustment.
Estimate of Disney Cost of Debt • The current yield on a Long Term Treasury bond is approximately 1.65% • Given the current (S&P) A- rating for Disney it would have a yield spread of 1.6% • Given a yield spread of 1.6% Disney’s cost of debt would be 3.25%
Flotation Costs • There is a cost of issuing new debt, paid to the investment bank handling the transaction. • This reduces the amount received by the firm and increases the interest cost for the firm.
Example • Assume the firm must pay $2.50 to the investment bank for each $100 of value. • This decreases the amount the firm receives to $97.50 per $100 in bond value, but it still is paying the same coupon rate. • The previous example for Disney: If we issued new bonds they should pay a coupon rate of 6% or a coupon of $6 each year for each $100 in par value.
Example • The YTM from the point of the firm comes from replacing value of the bond with $97.50 solving for r, r = 3.11 (x2=6.22% per year) Luckily, the actual cost is small enough that it is often ignored when calculating the cost of debt.
After Tax Cost of Debt • A portion of the interest is tax deductible so this will lower the actual cost of debt paid by the firm. • To adjust the cost of debt to account for the tax rate you need to multiply the before tax cost of debt by 1 minus the tax rate.
Other Debt • The firm may also have nontraded debt or other obligations that should be treated like debt (such as leases). • The long-term cost of borrowing can be used as an approximation for the cost of these debts. • Given the future value of lease obligations, the PV or those obligations (using the cost of debt as the interest rate) should be added to the market value of debt.
Cost of Preferred Stock • Review: Preferred Stock pays a constant dividend. V = Dividend / rps
Cost of Preferred Stock VPS = Dividend / rps Let Price = Value Rearrange this to solve for rps rPS = Dividend / Price
Example • GM pays a $3.25 dividend on its preferred stock selling for $55 a share. • kPS = 3.25/55 = .0591 = 5.91% • GM should pay 5.91% or $5.91 on every $100 of new preferred stock that it issues • What about flotation costs?
Example continued • Assume that GM must pay $3 for each $100 of stock it issues. • It then only receives $97 instead of $100 so the actual cost is: • rPS=5.91/(100-3) = 5.91/97 = .0609 =6.09% • generally: • rPS=Dividend / (Price - Flotation Cost)
Calculating the Cost of Common Equity • There are three methods: • Constant Growth (discounted cash flow approach) • CAPM • Bond- Plus- Risk Premium Approach
Cost of Common Equity • Constant Growth (Discounted Cash Flow) Let V = Price and solve for re
Cost of Common Equity • Discounted Cash Flow Approach is now easy: Stock Price = $25, Retention Rate = 20% ROE = 40% Last Dividend = $1
re with the CAPM • Review of CAPM • Three key inputs: • the risk free rate, market return, Beta • Estimating the cost is then easy from the security market line. • re= rRF + B( rM - rRF )
Applying the CAPM • The Risk Free Rate – Best Case • No Default Risk • No reinvestment rate risk (zero coupon bond) • Similar time period as cash flows under consideration • Solution – use a long-term government bond • Note the same risk free rate needs to be used in calculating the market risk premium.
Estimating the Risk Premium • The market risk premium should represent the extra risk inherent in the market portfolio compared to the risk free rate • Issues • Time frame used • Risk free rate used • Arithmetic or geometric average
Market Risk Premium • The calculation should be consistent with the choice of your risk-free rate • The shorter the time period used for the market return, the higher the standard error. • Shorter period represents fact that risk premiums may change over time. However standard error for 10 years is likely greater than the estimate of the premium
Market risk premium • Arithmetic Average – simple average of annual returns • Geometric Average – compounded return Accounts for possible serial correlation in return (positive years followed by negative year – supported empirically for 5 year windows but not 1 year windows)
Estimating the Components - Summary • Beta • Run Regression or Bottom up Beta • The Risk-Free Rate • Perfect world – No Default Risk and No Reinvestment Risk. Can use a coupon paying T- Bond is a proxy. • Match timing of cash flows • Market Return • S&P 500 or Wilshire 5000 Long term geometric average
re with Bond Plus Risk Premium • The return on corporate debt (rd) already encompasses the risk associated with the firm. • A quick estimate of the cost of equity can be found by adding a risk premium to the cost of debt. • re = rd + Risk Premium
re = rd + Risk Premium • What risk Premium should be used? • A general Rule of Thumb is between 3 and 5%. Exactly where depends upon the current economic conditions, firm specific risk and other factors.
What about flotation costs? • IF the firm must issue new common stock it will incur flotation costs which increase the cost of common equity. • The easiest method to adjust is the Discounted Cash Flow approach. Just like with preferred stock you adjust the price they receive: re=[D1/(P-flotation)] + g
Flotation Costs Amount of Avg. Flotation Cost Avg. Flotation Cost Capital RaisedCommon StockNew Debt 2-9.99 13.28 4.39 10-19.99 8.72 2.76 20-39.99 6.93 2.42 40-59.99 5.87 2.32 60-79.99 5.18 2.34 80-99.99 4.73 2.16 100-199.99 4.22 2.31 200-499.99 3.47 2.19 500 and up 3.15 1.64