Download
1 / 1
10 likes | 256 Views
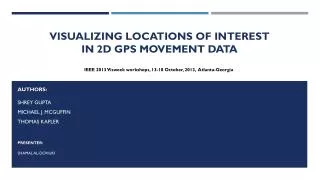
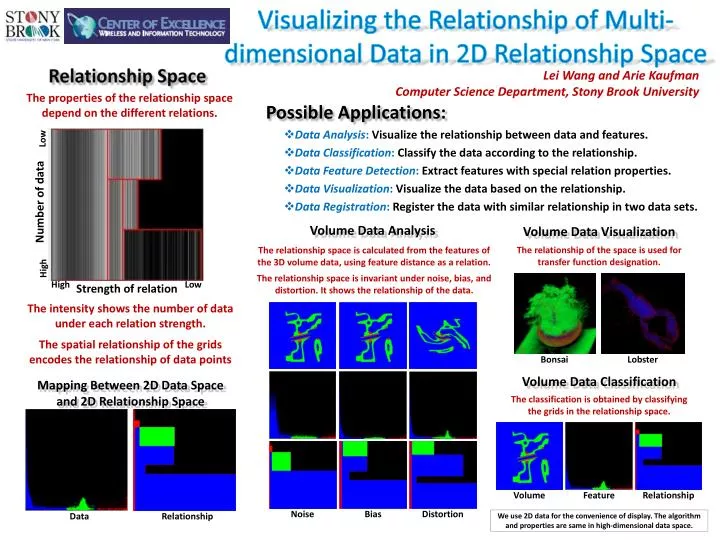
Mapping Between 2D Data Space and 2D Relationship Space. Lei Wang and Arie Kaufman Computer Science Department, Stony Brook University. Relationship Space. Possible Applications: Data Analysis : Visualize the relationship between data and features.

E N D
Mapping Between 2D Data Space and 2D RelationshipSpace Lei Wang and Arie Kaufman • Computer Science Department, Stony Brook University Relationship Space • Possible Applications: • Data Analysis: Visualize the relationship between data and features. • Data Classification: Classify the data according to the relationship. • Data Feature Detection: Extract features with special relation properties. • Data Visualization: Visualize the data based on the relationship. • Data Registration: Register the data with similar relationship in two data sets. The properties of the relationship space depend on the different relations. Low Visualizing the Relationship of Multi-dimensional Data in 2D Relationship Space Number of data Volume Data Analysis Volume Data Visualization The relationship space is calculated from the features of the 3D volume data, using feature distance as a relation. The relationship space is invariant under noise, bias, and distortion. It shows the relationship of the data. The relationship of the space is used for transfer function designation. High Data Relationship High Low Strength of relation The intensity shows the number of data under each relation strength. The spatial relationship of the grids encodes the relationship of data points Bonsai Lobster Volume Data Classification The classification is obtained by classifying the grids in the relationship space. Volume Feature Relationship Noise Bias Distortion • We use 2D data for the convenience of display. The algorithm and properties are same in high-dimensional data space.