Download
1 / 1
10 likes | 116 Views
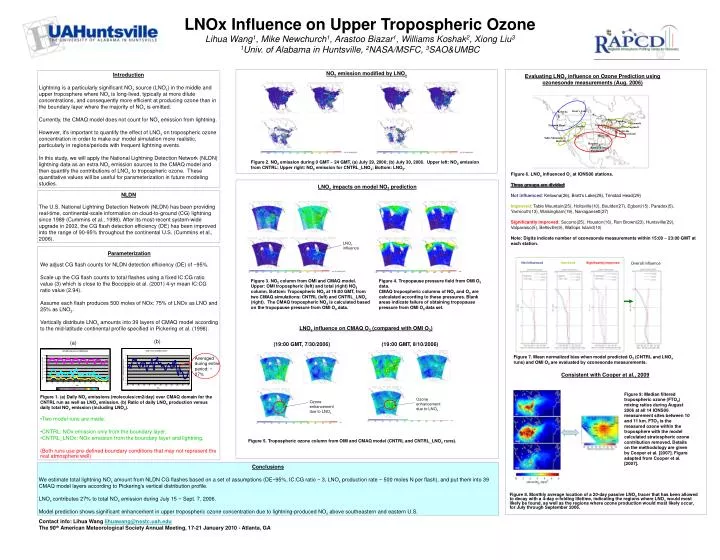
Not influenced Improved Significantly improved. Overall influence. Bratt’s Lake. Kelowna. Egbert. Paradox. Yarmouth. Valparaiso. Trinidad Head. Boulder. Narragansett. Walsingham. Beltsville. Wallops Island. LNO x influence. Socorro. Huntsville.

E N D
Not influenced Improved Significantly improved Overall influence Bratt’s Lake Kelowna Egbert Paradox Yarmouth Valparaiso Trinidad Head Boulder Narragansett Walsingham Beltsville Wallops Island LNOx influence Socorro Huntsville Table Mountain Holtville Houston Research vessel Ron Brown Ozone enhancement due to LNOx Ozone enhancement due to LNOx (b) (a) LNOx Influence on Upper Tropospheric OzoneLihua Wang1, Mike Newchurch1, Arastoo Biazar1, Williams Koshak2, Xiong Liu31Univ. of Alabama in Huntsville, 2NASA/MSFC, 3SAO&UMBC NO2 emission modified by LNOx Introduction Lightning is a particularly significant NOx source (LNOx) in the middle and upper troposphere where NOx is long-lived, typically at more dilute concentrations, and consequently more efficient at producing ozone than in the boundary layer where the majority of NOx is emitted. Currently, the CMAQ model does not count for NOx emission from lightning. However, it's important to quantify the effect of LNOx on tropospheric ozone concentration in order to make our model simulation more realistic, particularly in regions/periods with frequent lightning events. In this study, we will apply the National Lightning Detection Network (NLDN) lightning data as an extra NOx emission sources to the CMAQ model and then quantify the contributions of LNOx to tropospheric ozone. These quantitative values will be useful for parameterization in future modeling studies. Evaluating LNOx influence on Ozone Prediction using ozonesonde measurements (Aug. 2006) Figure 2. NO2 emission during 0 GMT ~ 24 GMT, (a) July 29, 2006; (b) July 30, 2006. Upper left: NO2 emission from CNTRL; Upper right: NO2 emission for CNTRL_LNOx; Bottom: LNO2. Figure 6. LNOx influenced O3 at IONS06 stations. Three groups are divided: Not influenced: Kelowna(26), Bratt’s Lake(28), Trinidad Head(29) Improved: Table Mountain(25), Holtsville(10), Boulder(27), Egbert(15), Paradox(5), Yarmouth(13), Walsingham(19), Narragansett(27) Significantly improved: Socorro(25), Houston(16), Ron Brown(23), Huntsville(29), Valparaiso(5), Beltsville(9), Wallops Island(10) Note: Digits indicate number of ozonesonde measurements within 15:00 ~ 23:00 GMT at each station. LNOx impacts on model NO2 prediction NLDN The U.S. National Lightning Detection Network (NLDN) has been providing real-time, continental-scale information on cloud-to-ground (CG) lightning since 1989 (Cummins et al., 1998). After its most-recent system-wide upgrade in 2002, the CG flash detection efficiency (DE) has been improved into the range of 90-95% throughout the continental U.S. (Cummins et al., 2006). Parameterization We adjust CG flash counts for NLDN detection efficiency (DE) of ~95%. Scale up the CG flash counts to total flashes using a fixed IC:CG ratio value (3) which is close to the Boccippio et al. (2001) 4-yr mean IC:CG ratio value (2.94). Assume each flash produces 500 moles of NOx; 75% of LNOx as LNO and 25% as LNO2. Vertically distribute LNOx amounts into 39 layers of CMAQ model according to the mid-latitude continental profile specified in Pickering et al. (1998). Figure 3. NO2 column from OMI and CMAQ model. Upper: OMI tropospheric (left) and total (right) NO2 column. Bottom: Tropospheric NO2 at 19:00 GMT, from two CMAQ simulations: CNTRL (left) and CNTRL_LNOx (right). The CMAQ tropospheric NO2 is calculated based on the tropopause pressure from OMI O3 data. Figure 4. Tropopause pressure field from OMI O3 data.CMAQ tropospheric columns of NO2 and O3 are calculated according to these pressures. Blank areas indicate failure of obtaining tropopause pressure from OMI O3 data set. LNOx influence on CMAQ O3 (compared with OMI O3) (19:00 GMT, 7/30/2006) (19:00 GMT, 8/10/2006) Figure 7. Mean normalized bias when model predicted O3 (CNTRL and LNOx runs) and OMI O3 are evaluated by ozonesonde measurements. Averaged during entire period: ~ 27% Consistent with Cooper et al., 2009 Figure 9: Median filtered tropospheric ozone (FTO3) mixing ratios during August 2006 at all 14 IONS06 measurement sites between 10 and 11 km. FTO3 is the measured ozone within the troposphere with the model calculated stratospheric ozone contribution removed. Details on the methodology are given by Cooper et al. [2007]. Figure adapted from Cooper et al. [2007]. • Figure 1. (a) Daily NOx emissions (molecules/cm2/day) over CMAQ domain for the CNTRL run as well as LNOx emission. (b) Ratio of daily LNOx production versus daily total NOx emission (including LNOx). • Two model runs are made: • CNTRL: NOx emission only from the boundary layer; • CNTRL_LNOx: NOx emission from the boundary layer and lightning. • (Both runs use pre-defined boundary conditions that may not represent the real atmosphere well) Figure 5. Tropospheric ozone column from OMI and CMAQ model (CNTRL and CNTRL_LNOx runs). Conclusions We estimate total lightning NOx amount from NLDN CG flashes based on a set of assumptions (DE~95%, IC:CG ratio ~ 3, LNOx production rate ~ 500 moles N per flash), and put them into 39 CMAQ model layers according to Pickering’s vertical distribution profile. LNOx contributes 27% to total NOx emission during July 15 ~ Sept. 7, 2006. Model prediction shows significant enhancement in upper tropospheric ozone concentration due to lightning-produced NOx above southeastern and eastern U.S. Figure 8. Monthly average location of a 20-day passive LNOx tracer that has been allowed to decay with a 4-day e-folding lifetime, indicating the regions where LNOx would most likely be found, as well as the regions where ozone production would most likely occur, for July through September 2006. Contact info: Lihua Wang lihuawang@nsstc.uah.edu The 90th American Meteorological Society Annual Meeting, 17-21 January 2010 - Atlanta, GA