Download
1 / 3
40 likes | 138 Views
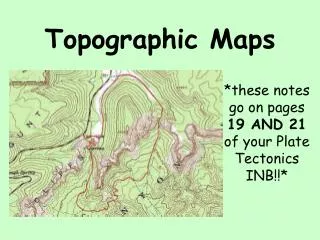
TOPOGRAPHIC MAPPING. GRAPHING COUNTOUR LINES. GRAPHING COUNTOUR LINE. CONTOUR INTERVALS – the distance ( m,ft ) between contour lines. Graphing contour lines shows you the elevation of a particular land structure. As the dots on the graph go up – the elevation of the land mass goes up.

E N D
TOPOGRAPHIC MAPPING GRAPHING COUNTOUR LINES
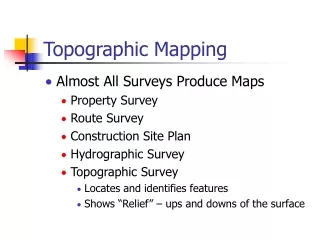
GRAPHING COUNTOUR LINE • CONTOUR INTERVALS – the distance (m,ft) between contour lines. • Graphing contour lines shows you the elevation of a particular land structure. • As the dots on the graph go up – the elevation of the land mass goes up. • As the dots on the graph go down – the elevation of the land mass goes down.
ACTIVITY • You are required to develop your own ‘island’ with contour lines and graph the ‘island’. • You must have 3 high points • 1 point must be higher than the others • Your contour intervals must bee 100m • There must be a ‘steep’ side.