Download
1 / 22
220 likes | 330 Views
Three-Step Database Design. Three-Step Database Design. Database applications are modeled using a three-step design process Conceptual-datatypes, relationships and constraints(ER model) Logical-mapping to a Relational model and associated query language(Relational Algebra)

E N D
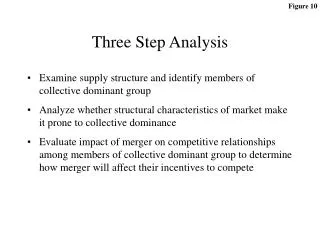
Three-Step Database Design • Database applications are modeled using a three-step design process • Conceptual-datatypes, relationships and constraints(ER model) • Logical-mapping to a Relational model and associated query language(Relational Algebra) • Physical-file structures, indexing,
Example Application Domain • Database design is for a specific application domain • Often a requirements document is available • Designers discuss requirements with end-users as needed • We will use a simple spatial application domain • to illustrate concepts in conceptual and logical data models • to illustrate translation of conceptual DM to logical DM • Spatial application domain • A state-park consists of forests. • A forest is a collection of forest-stands of different species • State-Park is accessed by roads and has a manager • State-Park has facilities • River runs through state-park and supplies water to the facilities
Conceptual DM: The ER Model • 3 basic concepts • Entities have an independent conceptual or physical existence. • Examples: Forest, Road, Manager, ... • Entities are characterized by Attributes • Example: Forest has attributes of name, elevation, etc. • An Entity interacts with another Entity through relationships. • Road allow access to Forest interiors. • This relationship may be name “Accesses” • Comparison with Object model of spatial information • Entities are collections of attributes are like objects • However ER model does not permit general user defined operations • Relationships are not directly supported in Object model • but may be simulated via operations
Relationship Types • Relationships can be categorized by • cardinality constraints • other properties, e.g. number of participating entities • Binary relationship: two entities participate • Types of Cardinality constraints for binary relationships • One-One: An instance of an entity relates to a unique instance of other entity. • Many-One: Many instances of an entity relate to an instance of an other. • Many-Many: Many instances of one entity relate to multiple instances of another. • Exercise: Identify type of cardinality constraint for following: • Many facilities belong to a forest. Each facility belong to one forest. • A manager manages 1 forest. Each forest has 1 manager. • A river supplies water to many facilities. A facility gets water from many rivers.
ER Diagrams Graphical Notation • ER Diagrams are graphic representation of ER models • Several different graphic notation are used • We use a simple notation summarized below • Example ER Diagram for Forest exampl in next slide
[ SLAYT ] ER Diagram for “State-Park” • Exercise: • List the entities, attributes, relationships in this ER diagram • Identify cardinality constraint for each relationship. • How many roads “Accesses” a “Forest_stand”? (one or many)
Logical Data Model: The Relational Model • Relational model is based on set theory • Main concepts • Domain: a set of values for a simple attribute • Relation: cross-product of a set of domains • Represents a table, i.e. homogeneous collection of rows (tuples) • The set of columns (i.e. attributes) are same for each row • Comparison to concepts in conceptual data model • Relations are similar to but not identical to entities • Domains are similar to attributes
Relational Schema • Schema of a Relation • Enumerates columns, identifies primary key and foreign keys. • Primary Key : • one or more attributes uniquely identify each row within a table • Foreign keys • R’s attributes which form primary key of another relation S • Value of a foreign key in any tuple of R match values in some row of S • Relational schema of a database • collection of schemas of all relations in the database • Example: next slide • A blue print summary drawing of the database table structures • Allows analysis of storage costs, data redundancy, querying capabilities • Some databases were designed as relational schema in 1980s • Nowadays, databases are designed as E R models and relational schema is generated via CASE tools
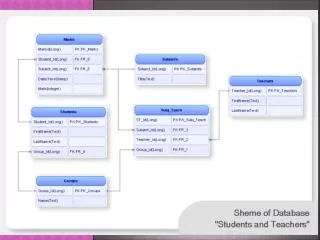
Relational Schema Example • Identify relations with • primary keys • foreign keys • other attributes • Compare with ER diagram • CASE – Computer-aided • Software Engineering tools, • Oracle designer, ERwin Question: Road-crosses-River is missing???
Relational Schema for “Point”, “Line”, “Polygon” and “Elevation” • Relational model restricts attribute domains • simple atomic values, e.g. a number • Disallows complex values (e.g. polygons) for columns • Complex values need to be decomposed into simpler domains • A polygon may be decomposed into edges and vertices String
More on Relational Model • Integrity Constraints • Key: Every relation has a primary key. • Entity Integrity: Value of primary key in a row is never undefined • Referential Integrity: Value of an attribute of a Foreign Key must appear as a value in the primary key of another relationship or must be null. • Normal Forms (NF) for Relational schema • Reduce data redundancy and facilitate querying • 1st NF: Each column in a relation contains an atomic value. • 2nd and 3rd NF: Values of non-key attributes are fully determined by the values of the primary key, only the primary key, and nothing but the primary key. • Other normal forms exists but are seldom used • Translating a well-designed ER model yields a relational schema in 3rd NF • satisfying definition of 1st, 2nd and 3rd normal forms
Mapping ER to Relational • Highlights of translation rules • Entity becomes Relation • Attributes become columns in the relation • Multi-valued attributes become a new relation • includes foreign key to link to relation for the entity • Relationships (1:1, 1:N) become foreign keys • M:N Relationships become a relation • containing foreign keys or relations from participating entities • Example and Exercise • Identify the relational schema components for • entity Facility, its attributes and its relationships
Extending ER with Spatial Concepts • Motivation • ER Model is based on discrete sets with no implicit relationships • Spatial data comes from a continuous set with implicit relationships • Any pair of spatial entities has relationships like distance, direction, … • Explicitly drawing all spatial relationship • clutters ER diagram • generates additional tables in relational schema • Misses implicit constraints in spatial relationships (e.g. partition) • Pictograms • Label spatial entities along with their spatial data types • Allows inference of spatial relationships and constraints • Reduces clutter in ER diagram and relational schema • Example: Next slide is simpler than earlier slide
Specifying Pictograms • Grammar based approach • Rewrite rule • like English syntax diagrams • Classes of pictograms • Entity pictograms • basic: point, line, polygon • collection of basic • ... • Relationship pictograms • partition, network
Entity Pictograms: Basic shapes, Collections Multi shape:
Entity Pictograms: Derived and Alternate Shapes • Derived shape example: A road is represented as a polygon for construction • or as a line for navigation - For certain conditions, for example, depending on the scale, a city center point can be represented as a polygon
Conceptual Data Modeling with UML • Motivation • ER Model does not allow user defined operations • Object oriented software development uses UML • UML stands for Unified Modeling Language • It is a standard consisting of several diagrams • class diagrams are most relevant for data modeling • UML class diagrams concepts • Attributes are simple or composite properties • Methods represent operations, functions and procedures • Class is a collection of attributes and methods • Relationship relate classes
UML Class Diagram with Pictograms: Example • Exercise: Identify classes, attributes, methods, relationships in this Figure.
Comparing UML Class Diagrams to ER Diagrams • Concepts in UML class diagram vs. those in ER diagrams • Class without methods is an Entity • Attributes are common in both models • UML does not have key attributes and integrity constraints • ER does not have methods • Relationships properties are richer in ER • Entities in ER diagram relate to datasets, but UML class diagram • can contain classes which have little to do with data
Summary • Spatial Information modeling can be classed into • Field based and Object based • Field based for modeling smoothly varying entities, like rainfall • Object based for modeling discrete entities, like country • A data model is a high level description of the data • it can help in early analysis of storage cost, data quality • Database are designed in 3-steps • Conceptual, Logical and Physical • Pictograms can simplify Conceptual data models