1 / 1

FIGURE S1

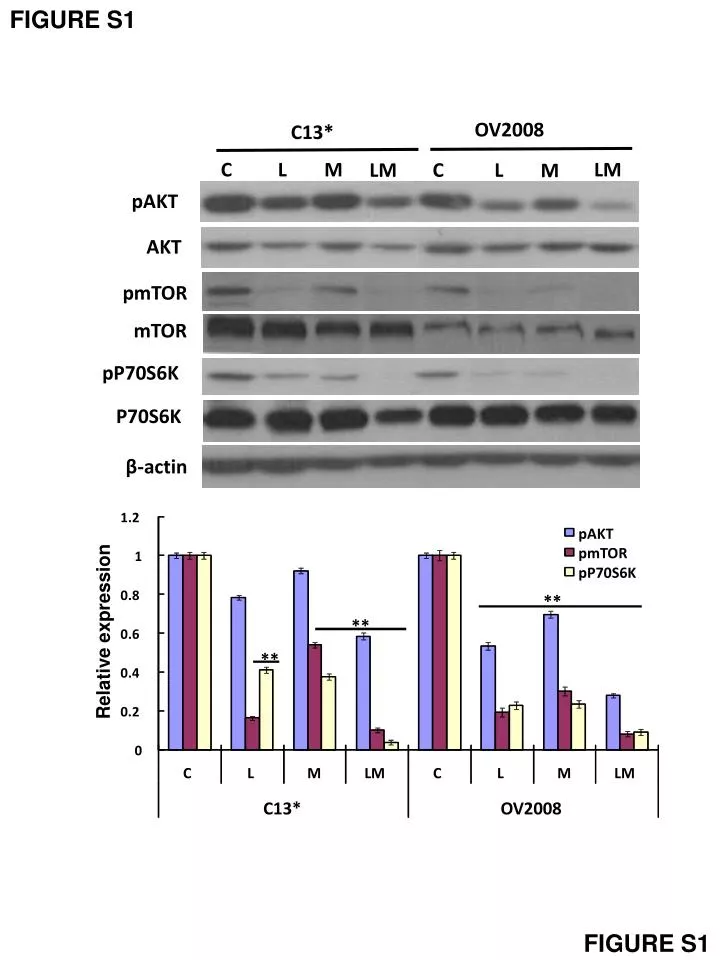
FIGURE S1. 1.2. pAKT. pmTOR. 1. pP70S6K. 0.8. **. **. 0.6. **. 0.4. 0.2. 0. C. L. M. LM. C. L. M. LM. C13*. OV2008. OV2008. C13*. C. L. M. LM. LM. C. L. M. pAKT. AKT. pmTOR. mTOR. pP70S6K. P70S6K. β-actin. Relative expression. FIGURE S1.

Download Presentation

FIGURE S1

An Image/Link below is provided (as is) to download presentation Download Policy: Content on the Website is provided to you AS IS for your information and personal use and may not be sold / licensed / shared on other websites without getting consent from its author. Content is provided to you AS IS for your information and personal use only. Download presentation by click this link. While downloading, if for some reason you are not able to download a presentation, the publisher may have deleted the file from their server. During download, if you can't get a presentation, the file might be deleted by the publisher.

E N D

Presentation Transcript


  1. FIGURE S1 1.2 pAKT pmTOR 1 pP70S6K 0.8 ** ** 0.6 ** 0.4 0.2 0 C L M LM C L M LM C13* OV2008 OV2008 C13* C L M LM LM C L M pAKT AKT pmTOR mTOR pP70S6K P70S6K β-actin Relative expression FIGURE S1

More Related