Download
1 / 19
190 likes | 292 Views
An International Irradiance Ingest System for Forecasting Solar Power and Agricultural Crop Yields. World Renewable Energy Forum May 15-17, 2012 Dr. James Hall. Sources for Solar Radiation Data. Regional Ground-Based Networks Built for specific purposes

E N D
An International Irradiance Ingest System for Forecasting Solar Power and Agricultural Crop Yields World Renewable Energy Forum May 15-17, 2012 Dr. James Hall
Sources for Solar Radiation Data • Regional Ground-Based Networks • Built for specific purposes • Complete coverage requires aggregating many networks • Earth Observation Satellites • Worldwide coverage • Data access from a single source Credit: NASA Credit: ESA Within 75 km ground-based sensors will generally provide more accurate estimates of irradiation.
Required Coverage Using the 75 km threshold, the continental US could be covered by 450 well-placed sites. Similarly, the EU could be covered with 250 sites.
Current Coverage – Historical Data We currently have historical hourly GHI (global horizontal irradiance) data from over 5000 ground sites for the past 5-30 years.
Current Coverage – Historical Data Using the 75 km threshold, these 5000 sites provide ground-based GHI data for essentially the entire US.
Current Coverage - Real-Time Data • A new system is now capturing real-time GHI and meteorological information from 2800 US and 160 EU ground sites. • By Dec 2012 we plan to be ingesting 4800 US and 1000 EU sites in real-time. • Observation frequency varies from 5 to 60 minutes. Typical latency in the observations is about 10 minutes.
Future Coverage - Real-Time Data When this real-time system is completed it will provide complete coverage of the US and EU with higher accuracy irradiance data and lower latency than can be obtained from satellite-based observations.
Real-Time Solar Data Ingest Today’s Data Weather Forecast Temporary Folders for Each Network Data Archive
Data Ingest Challenge: access thousands of sites from 100+ networks. Observations are asynchronous and may be missing or delayed. • The controller accesses a history of when the observations from each site have been available. • At the appropriate time, the controller forms a unique query for the site and places it in the queue. • A processing computer executes the queries as efficiently as possible and stores the responses in the appropriate folders. • To be considerate of the data provider's bandwidth and server resources, if the data is unavailable after several attempts a log of the event is sent to a separate system for backfilling. Network Folders
Data Processing Challenge: Data is ingested in over 100 different formats and must be converted and quality controlled in real-time Temporary Folders • All observations and measurement units are converted to a common format. • Typically one or more networks change their format each week. Reprogramming to adapt to these changes is a major part of the effort. • Each observation time is converted to universal time. We have found that the stated times on the observations may be in error, especially when networks cross time zones or change to/from daylight savings. Data Archive
Data Processing Sensors not passing multi-level quality control are excluded from the daily model. Temporary Folders • Each meteorological parameter is compared to a 30 year historical database for 4000+ locations. • Solar QC1 (quality control 1) compares the irradiance to a historical database of observations on the same day of the year for 300+ regions. • Solar QC2 compares the irradiance to that of nearby sites at similar elevations. • Solar QC3 estimates the calibration and bias of each sensor during clear sky events. Data Archive
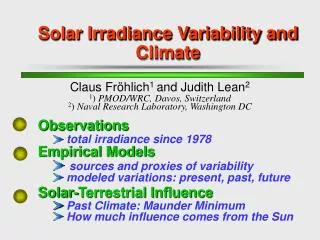
Nowcasting Definition: The forecasting of the weather within the next six hours is often referred to as nowcasting. In this time range it is possible to forecast smaller features such as individual showers and thunderstorms with reasonable accuracy. • Traditionally, nowcasts have relied on extrapolation and interpretation of the observations. Numerical Weather Prediction models focus on physics. • Nowcasts depend on observations that are accurate, high resolution, and real-time. (better data = better nowcasts) • Given the current state of NWP models for nowcasting, there is still a place for “human” interpretation of the observations and discovery of seasonal patterns.
Spatial-Temporal Model of GHI At regular intervals the irradiance data is used to generate a spatial-temporal model for the day. Today’s Data • The 4-D surface is like a movie of irradiance for the past few hours and extending several hours into the future • The nowcast extrapolates both the current sky clarity and the system dynamics. • This technique merges several forecasting technologies such as persistence, cloud motion vectors, cloud formation & dissipation, etc. T-3 Historical T-2 T-1 Time Now T+1 Nowcast T+2 T+3
Real-Time Data 4/23/2012 On 4/23/2012, 358 sites in California & Nevada passed the quality control filters.
Real-Time Data 4/23/2012 This 4D representation shows longitude (X), latitude (Y) and time of day (Z). The size of the balls represent GHI from morning (bottom) to evening (top). Rotating the plot, one can visualize the CA & NV state outlines.
Real-Time Data 4/23/2012 Hourly average GHI W/m2
Forecasts of Irradiance up to 4 Hours Ahead Solar Forecasts This ensemble forecasting model is adaptive and capable of learning based on the historical data presented and the forecast success.
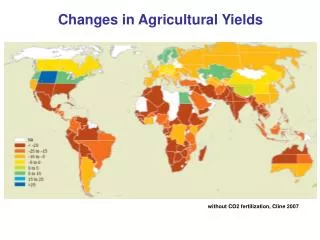
Crop Yield Forecasts Plant growth & yield Climate+++ Soils & Farm Practice+ Genetics++ The physiology of corn and soybean plants has been extensively modeled. When the genetics and local environmental factors are accurately known, it is possible to forecast daily growth and the final yield. Accurate and timely data on local solar radiation has been a missing link.
Future Plans • When the real-time ingest is completed it will offer nearly complete coverage of the US and EU with higher accuracy irradiance data and lower latency than can be obtained with satellite-based observations. • Beginning with California, we will be setting up a website with real-time nowcasts of solar irradiance 0 to 4 hours forward and live accuracy analysis of previous forecasts. • Beginning in 2013 we will begin forecasting US crop yields for corn and soybeans at the local, state and national levels.