Download
1 / 18
180 likes | 876 Views
Weather. ©Mark Place, 2009-2010 www.LearnEarthScience.com. weather basics. Where does the energy for weather originate?. the uneven heating of the Earth’s surface. weather basics. In the US, the general direction that weather systems move is toward. the northeast. Station Models.

E N D
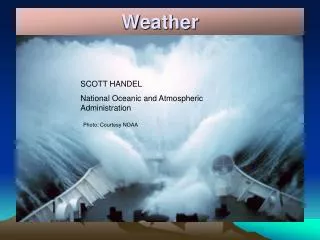
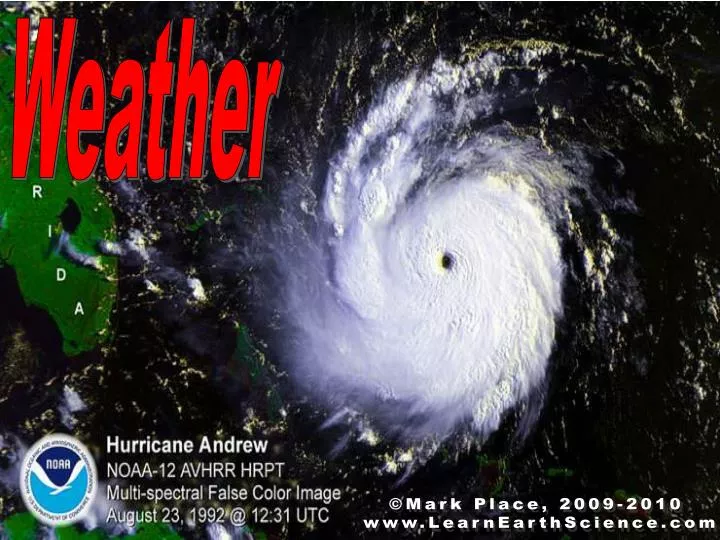
Weather ©Mark Place, 2009-2010 www.LearnEarthScience.com
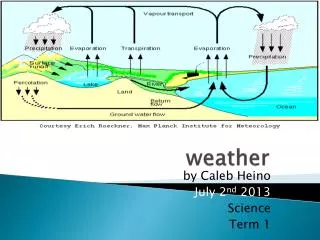
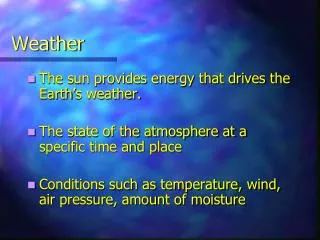
weather basics Where does the energy for weather originate? the uneven heating of the Earth’s surface
weather basics In the US, the general direction that weather systems move is toward the northeast
Station Models Please go to page 13 of the ESRTs Temperature and dewpoint are measured in degrees _______ F
Cloud Cover Temperature 76 138 Wind Direction & Speed .. -30\ Current Weather 55 Dewpoint Barometric Trend Barometric Pressure
Station Model Practice
Evaporation Rates Relative Humidity Temperature Surface Area
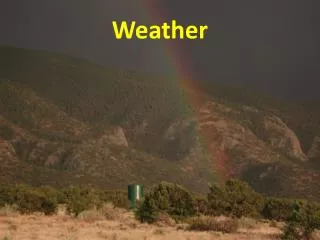
What natural process cleans the atmosphere? Rain precipitation Snow Hail
Cools to the dewpoint Expands Warm Air Rises
Clouds are likely to form when: The air is saturated and rising The temperature is at the dewpoint Condensation nuclei are available
As air temperature increases the air can hold more water
Sling Psychrometer Dry bulb measures air temperature Wet bulb temp is lower due to evaporation
Using the charts on page 12 of the ESRTs, calculate the relative humidity and dew point using the following information. 60 6 15 12 58 7 55 23 13 9 5 Dewpoint Chart RH Chart
Relative Humidity vs Air Temperature Indirect Relationship as temp increases RH decreases
As dew point increases, the amount of moisture in the air INCREASES
As temperature and dewpoint get closer together, the probability of precipitation INCREASES
Which has the greatest probability of precipitation?