Download
1 / 14
140 likes | 145 Views
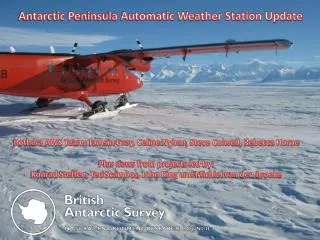
Climatology and Variability of Mesoscale Cyclones in the Western Antarctic Peninsula Region. Dan Lubin Scripps Institution of Oceanography Rob Wittenmyer Department of Astronomy, University of Texas Gareth Marshall British Antarctic Survey. American Meteorological Society

E N D
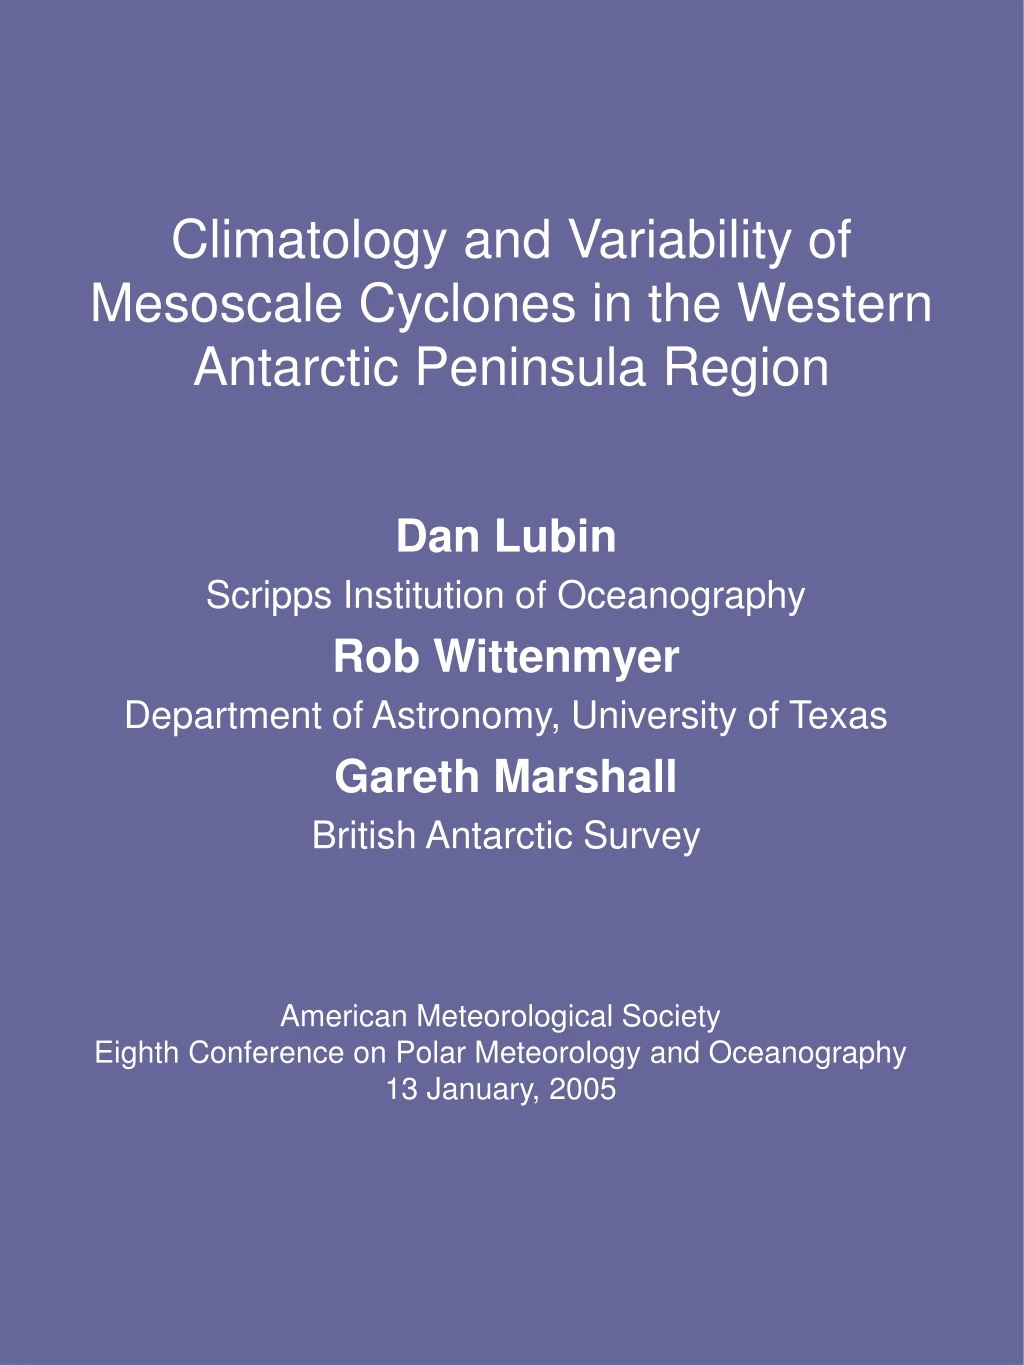
Climatology and Variability of Mesoscale Cyclones in the Western Antarctic Peninsula Region Dan Lubin Scripps Institution of Oceanography Rob Wittenmyer Department of Astronomy, University of Texas Gareth Marshall British Antarctic Survey American Meteorological Society Eighth Conference on Polar Meteorology and Oceanography 13 January, 2005
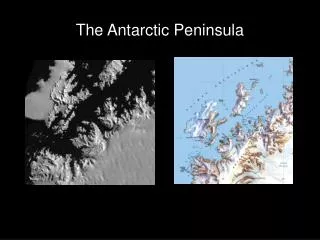
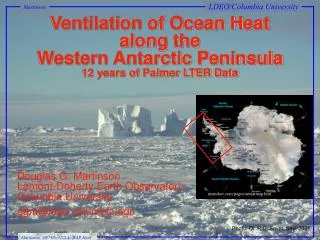
Western Antarctic Peninsula Warming • Since 1945, the WAP region has warmed by 2.5oC, five times the global average (Vaughan et al., 2002). • Sea ice retreat (Smith, Stammerjohn and Baker, 1996,1998) • Collapse of >3000 km2 of the Larsen B Ice Shelf in 1999 and again in 2002 • Decline by 33% in Adelie penguin populations over past 25 years (W. Fraser, LTER program) • Loss of sea ice habitat for over-winter foraging • Decrease in viability of permanent rookery locations
Thompson and Solomon, Science, 2002 Congruence with Southern Annular Mode • Cooling stratosphere in response to ozone depletion • Strengthening circumpolar westerlies • Trend in SAM toward high-index polarity • Supported by GCM study (Gillett and Thompson, Science, 2003)
Is Anything Observable in Satellite Data? • According to SAM hypothesis, strengthening westerlies should allow warmer air advection into WAP region, while further isolating air mass over Antarctic continent, suppressing cold-air outbreaks. • Is there evidence of this in the frequency or trajectories of mesoscale cyclones?
Arctic and Antarctic Research Center • An overblown name for a small satellite data operation at SIO • AARC collects and archives NOAA and DMSP polar orbiter data from NSF (SeaSpace, Inc.) tracking facilities at Palmer and McMurdo Stations • Data available at no cost to scientific community • Catalogue access at http://arcane.ucsd.edu • Graphical data search, pass map, browse imagery • Up to 20,000 overpasses archived per year • By spring 2005, look for data availability on RAID storage for instant download
Antarctic Peninsula Mesoscale Cyclones • Climatological features revealed by several studies of approximately one year of satellite data • Carrasco, Bromwich and Liu, 1997; Turner et al., 1996; Heinemann, 1996;Turner and Thomas, 1992, 1994; Carleton and Fitch, 1993; Carrasco and Bromwich, 1992 • Higher cyclonic activity over Bellingshausen Sea sector (BSS) versus Weddell Sea sector (WSS) • One exception being 1989-90 – interannual variability • Cyclones in BSS versus WSS: • Both sectors show maximum frequency in summer, minimum in winter • Tendency for northeastward trajectories in BSS, no apparent organized motion in WSS • WSS cyclones shallower, confined to lower troposphere; WSS cyclones deeper, many involving higher cloud layers
SAM Reconstructed from Observations Marshall, J. Climate, 2003 We examine AARC imagery from June 1991 – June 1994 (Useful variability in SAM index, AARC data volume manageable)
Conclusions • 1. Some possible relationships between SAM and cyclone frequency in WAP region • Fewer WSS cyclones under high SAM index, spring and fall • High SAM index: more winter BSS cyclones but fewer in summer • 2. High SAM index: • Cyclone trajectories in BSS closer to the Peninsula • However, most tracks are from west to east, rather than from lower latitudes into the region or to northeast • Suggesting a dynamical forcing of WAP sea ice? • 3. We’re looking at subsequent years of AARC data, for more even seasonal sampling in high versus low SAM index conditions.